USA30 Weekly Special Report based on 1.00 Lot Calculation:
USA30 INDEX:
- WHAT IS A STOCK INDEX: According to Investopedia.com, a stock index measures the price performance of a basket (group) of stocks using a standardized metric and methodology. The Dow Jones (USA30) is one of the world's best-known indexes and one of the most commonly used benchmarks for the stock market.
- COMPONENTS: USA30 includes 30 companies such as Amazon, Boeing, JPMorgan, Nike, Walmart, Coca-Cola and etc.
GEOPOLITICS: TRADE PROGRESS
- BREAKING NEWS (JUNE 26, 2025): TRUMP ANNOUNCES NEW TRADE DEAL WITH CHINA: President Trump announced that the U.S. signed a new trade agreement with China on Wednesday, calling it “a great deal for both countries” during a press briefing at the White House. While details remain limited, Trump said the deal covers key areas including agriculture, manufacturing, and digital trade, and aims to reduce tariffs gradually over the coming months.
- BREAKING (JUNE 26, 2025): TRUMP ANNOUNCED A DEAL WITH INDIA IS ALMOST DONE AS WELL
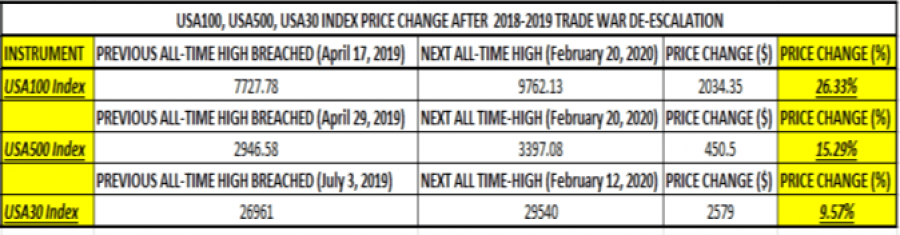
USA100, USA500, USA30 INDEX PRICE CHANGE AFTER 2018-2019 TRADE WAR DE-ESCALATION :
EVENTS:
- FRIDAY, JUNE 27, AT 13:30 GMT+1: US CORE PCE: This is the Fed’s preferred inflation measure. It is expected to rise from 2.5% to 2.6%. If the actual number comes in lower than the expected 2.6%, it could hurt the dollar as markets could expect rate cuts sooner. That would support stock market.
TECHNICAL ANALYSIS:
- LONGER-TERM TREND LINE: The blue trend line depicted by the chart below shows that USA30 prices have maintained their uptrend in general since April 2025. However, there remains a risk of a potential breakout below this level if market conditions change.
- 14-DAY RELATIVE STRENGTH INDEX (RSI) STAYS ABOVE 50: The chart below shows that the 14-day relative strength index (RSI) remains in an uptrend, floating above the break-even point of 50, towards the upper limit of 70, before it tries to enter an oversold territory and potentially change its trend.
- USA30 INDEX HIT AN ALL-TIME HIGH OF 45,224 (JANUARY 31, 2025). The index has traded around 43,860 and if a full recovery takes place, USA30 could rise around 3%. Although, the index could decline in price as well.
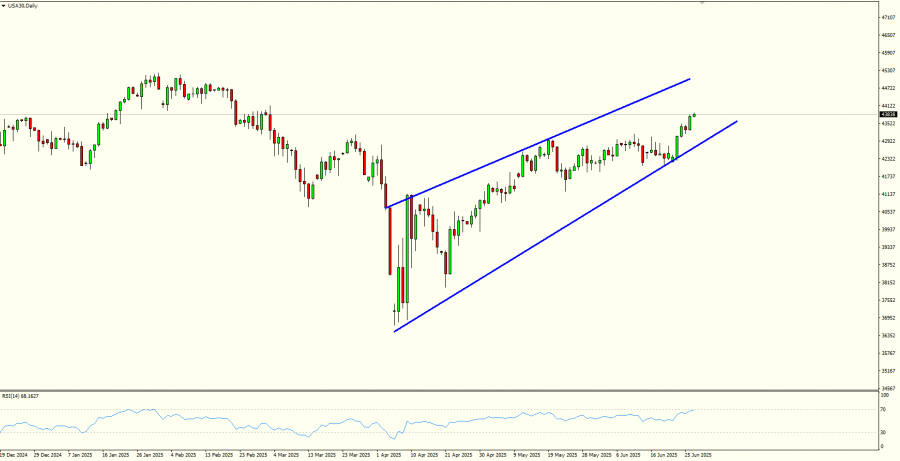
GRAPH (Daily): December 2024 – June 2025
Please note that past performance does not guarantee future results
USA30, June 27, 2025
Current Price: 43,860
|
USA30 |
Weekly |
|
Trend direction |
|
|
47,000 |
|
|
46,000 |
|
|
44,800 |
|
|
43,000 |
|
|
42,700 |
|
|
42,400 |
Example of calculation base on weekly trend direction for 1.00 Lot1
|
USA30 |
||||||
|
Profit or loss in $ |
31,400 |
21,400 |
9,400 |
-8,600 |
-11,600 |
-14,600 |
|
Profit or loss in €² |
26,787 |
18,256 |
8,019 |
-7,337 |
-9,896 |
-12,455 |
|
Profit or loss in £² |
22,849 |
15,572 |
6,840 |
-6,258 |
-8,441 |
-10,624 |
|
Profit or loss in C$² |
42,830 |
29,190 |
12,822 |
-11,731 |
-15,823 |
-19,915 |
- 1.00 lot is equivalent of 10 units
- Calculations for exchange rate used as of 10:00 (GMT+1) 27/06/2025
There is a possibility to use Stop-Loss and Take-Profit.
- You may wish to consider closing your position in profit, even if it is lower than suggested one.
- Trailing stop technique could protect the profit.