Special Report: USA100
Date: March 12, 2024
WEEKLY TREND: UP
US STOCK MARKETS
- STOCK MARKET TREND DEFINITION
BULL MARKET: DEFINITION. While bear markets signal a time of pessimism and economic decline, a bull market is defined by optimism and economic growth. A bull market is a period when stock prices are rising and investor sentiment is positive. During a bull market, stocks in a broad market index increase in value by 20% or more from recent bottom.
According to First Trust, the average bull market period lasted 6.6 years with an average cumulative total return of 339%.
BEAR MARKET: DEFINITION. According to Forbes, economists define a bear market as a decline of 20% or more of a major stock market index, such as the NASDAQ 100, for a sustained period. SENTIMENT: During a bear market, market sentiment is poor. Investors are pessimistic about the stock market’s prospects, making them more likely to sell Instrument than hold them.
Table I: Bear and Bull Market Characteristics
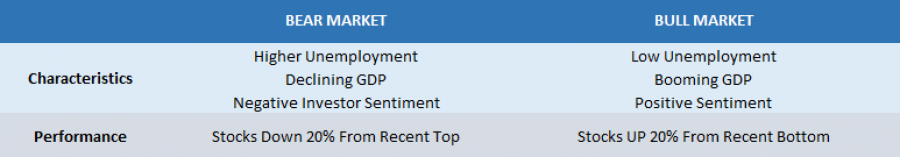
Data Source: Forbes
- PAST BULL MARKET DRIVEN BY TECHNOLOGICAL INNOVATIONS:
ERA: Dotcom
PERIOD: 1995- 2000
MEANING: The dotcom bubble was a rapid rise in U.S. technology stock equity valuations fueled by investments in Internet-based companies during the bull market in the late 1990s.
USA100 PERFORMANCE: UP more than 400% from 1995 to 2000.
INDIVIDUAL STOCKS: Notable Individual Stock Increase (1995- 2000):
- MICROSOFT UP around 1300%
- AMAZON UP around 2500%
Source: Investopedia
However, please note that past performance does not guarantee future results.
- ARTIFICIAL INTELLIGENCE (AI) (STARTING A NEW BULL MARKET)
ERA: Artificial Intelligence (AI)
PERIOD: November 2022- Present
MEANING: According to TECHTARGET.COM, Artificial Intelligence is the simulation of human intelligence processes by machines, especially computer systems. Specific applications of AI include expert systems, natural language processing, speech recognition and machine vision. AI is important for its potential to change how we live, work and play. It has been effectively used in business to automate tasks done by humans, including customer service work, lead generation, fraud detection and quality control. In some areas, AI can perform tasks much better than humans.
- NEXT EVENTS
US FEDERAL RESERVE MEETING: MARCH 20, 2024. The US Fed will meet next week with markets expecting that the bank will start cutting interest rates in June. The rates are expected to come down to at least 4.75% by the end of the year. The Fed will also announce its inflation, GDP and unemployment projections for the rest of 2024 and beyond. If the Fed points to a more aggression rate cutting cycle, the USA100 index could be expected to cheer up and continue to rise in value.
USA100, March 12, 2024
Current Price:18,200
|
USA100 |
Weekly |
|
Trend direction |
|
|
20,400 |
|
|
19,800 |
|
|
19,100 |
|
|
17,400 |
|
|
17,000 |
|
|
16,700 |
Example of calculation based on weekly trend direction for 1 Lot1
|
USA100 |
||||||
|
Pivot Points |
||||||
|
Profit or loss in $ |
22,000 |
16,000 |
9,000 |
-8,000 |
-12,000 |
-15,000 |
|
Profit or loss in €2 |
20,143 |
14,649 |
8,240 |
-7,325 |
-10,987 |
-13,734 |
|
Profit or loss in £2 |
17,212 |
12,518 |
7,041 |
-6,259 |
-9,388 |
-11,736 |
|
Profit or loss in C$2 |
29,641 |
21,557 |
12,126 |
-10,779 |
-16,168 |
-20,210 |
1. 1.00 lot is equivalent of 10 units
2. Calculations for exchange rate used as of 09:20 (GMT) 12/03/2024
Fortrade recommends the use of Stop-Loss and Take-Profit, please speak to your Senior Account ManagerClient Manager regarding their use.
- You may wish to consider closing your position in profit, even if it is lower than suggested one
- Trailing stop technique can protect the profit – Ask your Senior Account ManagerClient Manager for more detail