USA30 Weekly Special Report based on 1.00 Lot Calculation:
- WHAT IS A STOCK INDEX: According to Investopedia.com, a stock index measures the price performance of a basket (group) of stocks using a standardized metric and methodology. The Dow Jones (USA30) is one of the world's best-known indexes and one of the most commonly used benchmarks for the stock market.
- COMPONENTS: USA30 includes 30 companies such as Amazon, Boeing, JPMorgan, Nike, Walmart, Coca-Cola and etc.
- Q1’ 24 EARNINGS SEASON HAS OFFICIALLY STARTED ON APRIL 12. Each season, the banking sector led by Citigroup, JPMorgan, Wells Fargo and Goldman Sachs report their earnings results first. Later on, big companies such as Netflix, Tesla, Amazon, Meta, Microsoft and Apple will release their Q1 earnings reports.
- EARNINGS PERFORMANCE: According to LSEG, on average more than 70% of companies have beat earnings estimates over the past five quarterly earnings seasons.
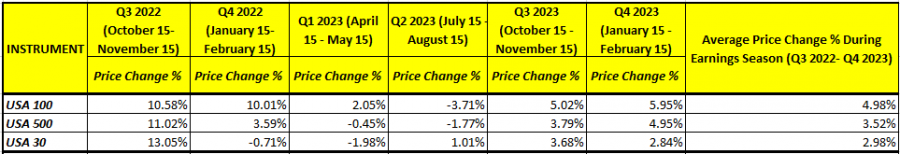
- LAST SIX QUARTERLY EARNINGS SEASONS: THE ARTIFICIAL INTELLIGENCE (A.I.) EUPHORIA. The table below illustrates price reactions of the three major US stock indices. On average, the USA 100 index has risen by 4.98% each quarterly earnings season since Q3 2022. Over the same period, the USA500 index rose 3.52%, while the USA30 index climbed around 3.00%.
Data Source: MetaTrader 4 Platform
Please note that past performance does not guarantee future results.
USA30, April 15 2024
Current Price:38,330.00
|
USA30 |
Weekly |
|
Trend direction |
|
|
42,958.00 |
|
|
40,000.00 |
|
|
39,000.00 |
|
|
37,709.00 |
|
|
37,500.00 |
|
|
37,300.00 |
Example of calculation base on weekly trend direction for 1.00 Lot1
|
USA30 |
||||||
|
Profit or loss in $ |
46,280.00 |
16,700.00 |
6,700.00 |
-6,210.00 |
-8,300.00 |
-10,300.00 |
|
Profit or loss in €² |
43,417.08 |
15,666.92 |
6,285.53 |
-5,825.84 |
-7,786.55 |
-9,662.83 |
|
Profit or loss in £² |
37,063.35 |
13,374.20 |
5,365.70 |
-4,973.28 |
-6,647.06 |
-8,248.76 |
|
Profit or loss in C$² |
63,568.59 |
22,938.54 |
9,202.89 |
-8,529.84 |
-11,400.59 |
-14,147.72 |
1. 1.00 lot is equivalent of 10 units
2. Calculations for exchange rate used as of 11:07 (GMT+1) 15/04/2024
Fortrade recommends the use of Stop-Loss and Take-Profit, please speak to your Senior Account ManagerClient Manager regarding their use.
- You may wish to consider closing your position in profit, even if it is lower than suggested one
- Trailing stop technique can protect the profit – Ask your Senior Account ManagerClient Manager for more detail