USA30 Weekly Special Report based on 1.00 Lot Calculation:
USA30:
- WHAT IS A STOCK INDEX: According to Investopedia.com, a stock index measures the price performance of a basket (group) of stocks using a standardized metric and methodology. The Dow Jones (USA30) is one of the world's best-known indexes and one of the most commonly used benchmarks for the stock market.
- COMPONENTS: USA30 includes 30 companies such as Amazon, Boeing, JPMorgan, Nike, Walmart, Coca-Cola, etc.
GEOPOLITICS: RUSSIA- UKRAINE/USA
- EVENT (FRIDAY, AUGUST 15 AT 20:30 GMT+1): US PRESIDENT DONALD TRUMP AND RUSSIAN PRESIDENT VLADIMIR PUTIN MEETING IN ALASKA, USA. The US and Russia have agreed to hold a meeting between Donald Trump and Vladimir Putin on Friday (August 15), to discuss ways forward to end the war in Ukraine, marking the first high-level bilateral talks since Trump returned to office.
TRADE: OPTIMISM PREVAILS
- BREAKING (AUGUST 11): US PRESIDENT TRUMP EXTENDED CHINA TARIFF TRUCE FOR ANOTHER 90 DAYS. President Donald Trump signed an executive order delaying the reinstatement of higher U.S. tariffs on Chinese goods for an additional 90 days, moving the deadline to mid-November 2025. Without the extension, U.S. duties would have reverted to April levels, when tariffs on Chinese imports reached 145% and China retaliated with 125% duties on U.S. goods.
CENTRAL BANKS:
- WEDNESDAY, SEPTEMBER 17 AT 19:00 GMT+1: US FEDERAL RESERVE INTEREST RATE DECISION. After some weaker-than-expected employment market data in July and downward revisions to June figures, markets have increased their expectations for an interest rate cut in September, expected to be followed by another in December. The benchmark interest rate currently stands at 4.5%, and according to market expectations, it is expected to decline to 4% by the end of 2025. This could put negative pressure on the US dollar and, in turn, support the US stock price.
TECHNICAL ANALYSIS:
- LONGER-TERM TREND LINE: The blue trend line depicted by the chart below shows that USA30 prices have maintained their uptrend in general since April 2025. However, there remains a risk of a potential breakout below this level if market conditions change.
- USA30 REMAINS ABOVE 20- AND 50- DAY MOVING AVERAGES: The daily graph below shows that USA30 has remained above two, technically, crucial moving averages, indicating an ongoing uptrend. Although the trend could change if prices fall below the 20- and 50-Day Moving Averages.
- BREAKING (AUGUST 15, 2025): USA30 HIT AN ALL-TIME HIGH OF 45,366.
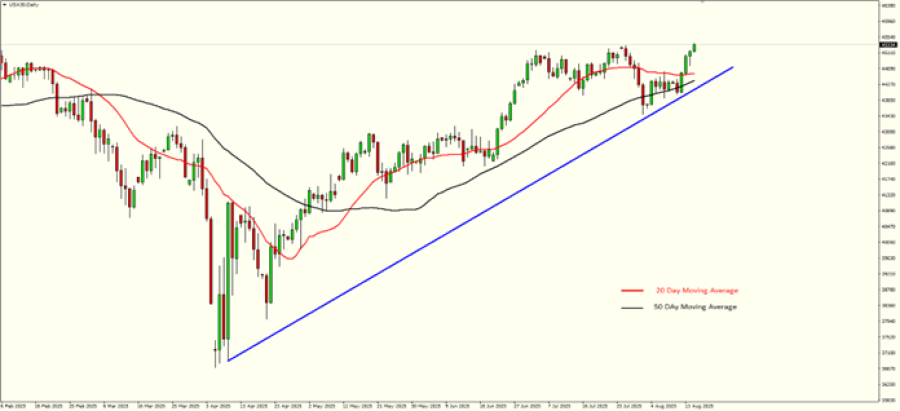
GRAPH (Daily): February 2025 – August 2025
Please note that past performance does not guarantee future results
USA30, August 15, 2025
Current Price: 45,290
|
USA30 |
Weekly |
|
Trend direction |
|
|
48,000 |
|
|
47,000 |
|
|
46,200 |
|
|
44,400 |
|
|
44,200 |
|
|
44,000 |
Example of calculation based on weekly trend direction for 1.00 Lot1
|
USA30 |
||||||
|
Profit or loss in $ |
27,100 |
17,100 |
9,100 |
-8,900 |
-10,900 |
-12,900 |
|
Profit or loss in €² |
23,200 |
14,639 |
7,790 |
-7,619 |
-9,331 |
-11,044 |
|
Profit or loss in £² |
20,005 |
12,623 |
6,717 |
-6,570 |
-8,046 |
-9,523 |
|
Profit or loss in C$² |
37,382 |
23,588 |
12,553 |
-12,277 |
-15,036 |
-17,795 |
- 1.00 lot is equivalent of 10 units
- Calculations for exchange rate used as of 10:50 (GMT+1) 15/08/2025
There is a possibility to use Stop-Loss and Take-Profit.
- You may wish to consider closing your position in profit, even if it is lower than suggested one.
- Trailing stop technique could protect the profit.