USA500 Weekly Special Report based on 1.00 Lot Calculation:
USA500:
- USA500 represents the S&P 500, which includes 500 of the largest publicly traded companies in the United States across all major sectors. It features industry leaders such as Tesla, Apple, Google, Nvidia, Meta, and Goldman Sachs. In essence, USA500 offers a broad overview of the U.S. economy, combining technology, finance, healthcare, energy, and more into a single market benchmark.
TRADE TALKS (USA – CHINA):
- JUNE 9: US- CHINA TRADE TALKS BEGIN IN LONDON, UK, ON JUNE 9 AND ARE SET TO CONTINUE ON TUESDAY AT 10:00 GMT+1 (JUNE 10): China’s Vice Premier He Lifeng is in the UK to lead the first US-China trade consultation meeting. On June 9, U.S. officials, including Treasury and Commerce Secretaries, began talks with the Chinese delegation in London. President Trump said discussions are going well, but gave no specifics. He hinted at possible changes to export controls. The U.S. seeks a commitment from China on rare earth exports. Meanwhile, China’s exports to the U.S. dropped 34.5% in May, adding urgency to the talks.
- RECENT HISTORY (US-CHINA REDUCED TARIFFS ON EACH OTHER FOR 90 DAYS ON MAY 12, 2025): USA500 ROSE 5.19% THE WEEK BETWEEN MAY 9 AND MAY 16, 2025. Trade war de-escalation between the two largest economies in the world, the USA and China, tends to create positive sentiment with the US stock market, although prices could go in the opposite direction as well.
Please note that past performance does not guarantee future results
EVENTS
- WEDNESDAY, JUNE 11 AT 13:30 GMT+1: US INFLATION (CPI) (MAY). U.S. inflation has continued to fall in 2025, hitting 2.3% in April, which is the lowest rate since early 2021. If data continues to show firm declines in May, investors will increase their expectations for a Fed interest rate cut sooner rather than later. This, in turn, could put positive pressure on USA500, although prices could go in the other direction, too.
- WEDNESDAY, JUNE 18 AT 19:00 GMT+1: US FEDERAL RESERVE INTEREST RATE DECISION. The Fed meets on June 18, as markets anticipate possible rate cuts amid slowing data. President Trump has intensified pressure, urging the Fed to ease policy, accusing it of stalling growth. If markets adopt higher expectations for Fed interest rate cuts sooner rather than later, US stock prices, including USA500 prices, could see some upward pressure. Although prices could go in the other direction.
TECHNICAL ANALYSIS:
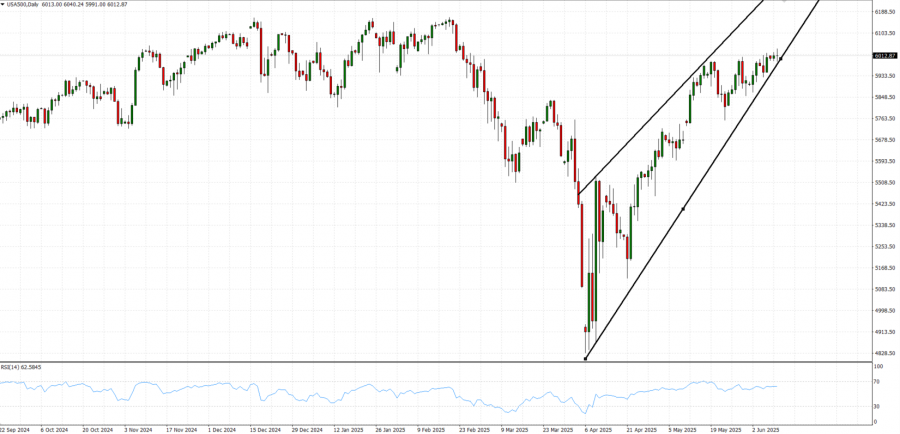
- LONGER-TERM TREND LINE: The black trend line depicted by the chart below shows that USA500 prices have maintained their uptrend in general since April 2025. However, there remains a risk of a potential breakout below this level if market conditions change.
- 14-DAY RELATIVE STRENGTH INDEX (RSI) STAYS ABOVE 50: The chart below shows that the 14-day relative strength index (RSI) remains in an uptrend, floating above the break-even point of 50, towards the upper limit of 70, before it tries to enter an oversold territory and potentially change its trend.
- USA500 HIT AN ALL-TIME HIGH OF 6,165.82 (FEBRUARY 19, 2025). The index has traded around 6,000, and if a full recovery takes place, USA500 could rise around 2.8%. Although the index could decline in price as well.
GRAPH (Daily): September 2024 – June 2025
Please note that past performance does not guarantee future results
USA500, June 10, 2025
Current Price: 6,000
|
USA500 |
Weekly |
|
Trend direction |
|
|
6,500 |
|
|
6,300 |
|
|
6,120 |
|
|
5,890 |
|
|
5,870 |
|
|
5,850 |
Example of calculation based on weekly trend direction for 1.00 Lot1
|
USA500 |
||||||
|
Profit or loss in $ |
5,000 |
3,000 |
1,200 |
-1,100 |
-1,300 |
-1,500 |
|
Profit or loss in €² |
4,383 |
2,630 |
1,052 |
-964 |
-1,140 |
-1,315 |
|
Profit or loss in £² |
3,708 |
2,225 |
890 |
-816 |
-964 |
-1,112 |
|
Profit or loss in C² |
6,851 |
4,111 |
1,644 |
-1,507 |
-1,781 |
-2,055 |
- 1.00 lot is equivalent of 10 units
- Calculations for exchange rate used as of 09:30 (GMT+1) 10/06/2025
There is a possibility to use Stop-Loss and Take-Profit.
- You may wish to consider closing your position in profit, even if it is lower than suggested one.
- Trailing stop technique could protect the profit.