USA500 Weekly Special Report based on 1.00 Lot Calculation:
USA500:
- USA500 represents the S&P 500, which includes 500 of the largest publicly traded companies in the United States across all major sectors. It features industry leaders such as Tesla, Apple, Google, Nvidia, Meta, and Goldman Sachs.
US Q3 EARNINGS SEASON (OCTOBER 14 - NOVEMBER 15, 2025):
- US Q3 EARNINGS SEASON BEGINS IN OCTOBER: The Q3 company earnings season is expected to begin with the banking sector in mid-October 2025. Companies such as Apple, Alphabet (Google), Meta (Facebook), AMD, Netflix, and Microsoft are also expected to report their Q3 earnings results in this Q3 quarterly season.
- STATISTICS (LAST 12 QUARTERS): USA500 PRICE ROSE ON AVERAGE 3.34% DURING THE QUARTERLY SEASON SINCE A.I. BOOM BEGAN IN Q3 2022.
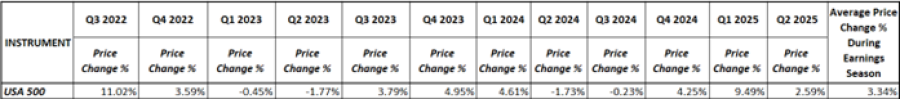
Data Source: MetaTrader 4 Platform
Please note that past performance does not guarantee future results
COMPANY EVENTS (OCTOBER 2025):
- NETFLIX: Q3 EARNINGS REPORT (OCTOBER 21, AFTERMARKET).
- TESLA: Q3 EARNINGS REPORT (OCTOBER 22, AFTERMARKET).
- INTEL: Q3 EARNINGS REPORT (OCTOBER 23, AFTERMARKET).
- ALPHABET (GOOGLE): Q3 EARNINGS REPORT (OCTOBER 29, AFTERMARKET).
- META (FACEBOOK): Q3 EARNINGS REPORT (OCTOBER 29, AFTERMARKET).
- MICROSFOT: Q3 EARNINGS REPORT (OCTOBER 29, AFTERMARKET).
- APPLE: Q3 EARNINGS REPORT (OCTOBER 29, AFTERMARKET).
- NVIDIA: NVIDIA GTC A.I. EVENT (WASHINGTON, D.C., USA) (OCTOBER 27 – 29).
US FEDERAL RESERVE:
- BREAKING (SEPTEMBER 17): US FEDERAL RESERVE CUT INTEREST RATE TO 4.25% FROM 4.50%, ITS FIRST INTEREST RATE CUT SINCE DECEMBER 2024. The Federal Reserve policymakers said they expect to see 2 more rate cuts by the end of 2025, to slash current rates to 3.75%.
- NEXT FEDERAL RESERVE MEETING AND INTEREST RATE DECISION: October 29. Interest rates are expected to be further cut to 4.00%.
- DECEMBER 10: The US Federal Reserve is expected to finish the year 2025 by cutting the rates to 3.75% on December 10.
TECHNICAL ANALYSIS:
- UPTREND CHANNEL: The USA500 has remained within a rising channel since April 2025, indicating sustained strength. A break below the channel could signal a potential shift in trend.
- MOVING AVERAGES: The 20-, 50-, and 100-day moving averages slope upward below current prices, confirming the uptrend. Staying above them supports continuation, while a drop below may signal a pause or corrective pullback.
- PRICE ACTION: USA500 PRICE HAS RISEN AROUND 12.45% SINCE THE START OF 2025.
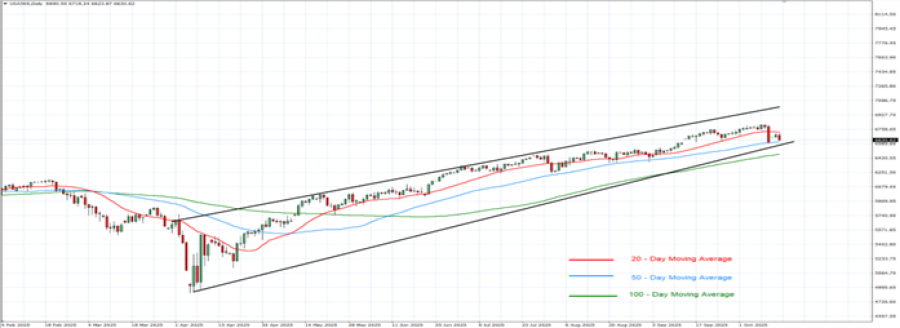
GRAPH (Daily): March 2025– October 2025
Please note that past performance does not guarantee future results.
#USA500, October 14, 2025.
Current Price: 6,630
|
USA500 |
Weekly |
|
Trend direction |
|
|
7,100 |
|
|
6,950 |
|
|
6,800 |
|
|
6,500 |
|
|
6,450 |
|
|
6,400 |
Example of calculation based on weekly trend direction for 1.00 Lot1
|
USA500 |
||||||
|
Pivot Points |
||||||
|
Profit or loss in $ |
4,700 |
3,200 |
1,700 |
-1,300 |
-1,800 |
-2,300 |
|
Profit or loss in €² |
4,066 |
2,769 |
1,471 |
-1,125 |
-1,557 |
-1,990 |
|
Profit or loss in £² |
3,543 |
2,412 |
1,281 |
-980 |
-1,357 |
-1,734 |
|
Profit or loss in C$² |
6,610 |
4,500 |
2,391 |
-1,828 |
-2,531 |
-3,235 |
- 1.00 lot is equivalent of 10 units
- Calculations for exchange rate used as of 13:10 (GMT+1) 14/10/2025
There is a possibility to use Stop-Loss and Take-Profit
- You may wish to consider closing your position in profit, even if it is lower than the suggested one.
- Trailing stop technique could protect the profit