AUD/USD
August 25, 2026
Risk Disclaimer: The example below is for illustrative purposes only and is based on price movements derived from Contracts for Difference (CFDs). The calculations reflect hypothetical outcomes using historical or specified price data for the relevant instrument on the stated date and are not indicative of future performance. Any reliance placed on this material is strictly at the user’s own risk.
AUD/USD Weekly Special Report Based on 1 Lot Calculation:
JACKSON HOLE ECONOMIC SYMPOSIUM HOSTED BY THE U.S. FEDERAL RESERVE
- EVENT (AUGUST 27 – 29): JACKSON HOLE ECONOMIC SYMPOSIUM HOSTED BY U.S. FEDERAL RESERVE. The annual Jackson Hole Economic Symposium, hosted by the Federal Reserve Bank of Kansas City, brings together global central bankers, economists, and policymakers to discuss key economic challenges. Markets will focus on U.S. monetary policy, inflation, economic growth, and future interest rate decisions under new Fed Chair Kevin Warsh.
- EVENT (FRIDAY, AUGUST 28 AT 15:00 GMT+1): U.S. FED CHAIR KEVIN WARSH SPEECH. His first Jackson Hole speech as Fed Chair could provide important insight into the Fed’s policy direction.
EVENTS:
- WEDNESDAY, AUGUST 26 AT 13:30 GMT+1: U.S. GROSS DOMESTIC PRODUCT (GDP) (Q2). A preliminary report published at the end of July showed a decrease from 2.1% to 1.5%. Another disappointing report may increase concern regarding the U.S. economy and have a negative impact on the U.S. dollar giving support to AUD/USD prices.
- WEDNESDAY, AUGUST 26 AT 13:30 GMT+1: U.S. CORE PCE PRICE INDEX (JULY). Investors will closely watch the Federal Reserve’s preferred inflation measure after Core PCE remained at 3.3% in June. Another decline could further reduce expectations of interest rate hikes, weakening the U.S. dollar and supporting AUD/USD price.
U.S. GOVERNMENT:
- BREAKING (AUGUST 19): U.S. TREASURY ANNOUNCES MORE AGGRESSIVE LONG-TERM BOND REPURCHASE PROGRAMME. On September 9, the U.S. Treasury will begin a more aggressive programme to inject money into the U.S. economy by repurchasing longer-term U.S. government bonds. The latest reports suggest that the U.S. Treasury Department could use an account holding around $1 trillion to help implement the programme. Increased money supply could put further downward pressure on the U.S. Dollar, supporting AUD/USD prices.
TECHNICAL ANALYSIS:
- LONGER-TERM UPTREND CHANNEL: The chart indicates that AUD/USD has been trading within a rising channel since late August 2025, with higher highs and higher lows supporting the broader positive structure. The pair continues to respect the channel boundaries.
- 100-DAILY MOVING AVERAGE (MA): AUD/USD has recently bounced off its 100-day moving average, reinforcing it as dynamic support. The fact that the price remains above the 100-day MA confirms that positive momentum is still intact. However, a clean break below this level could signal the beginning of a negative trend.
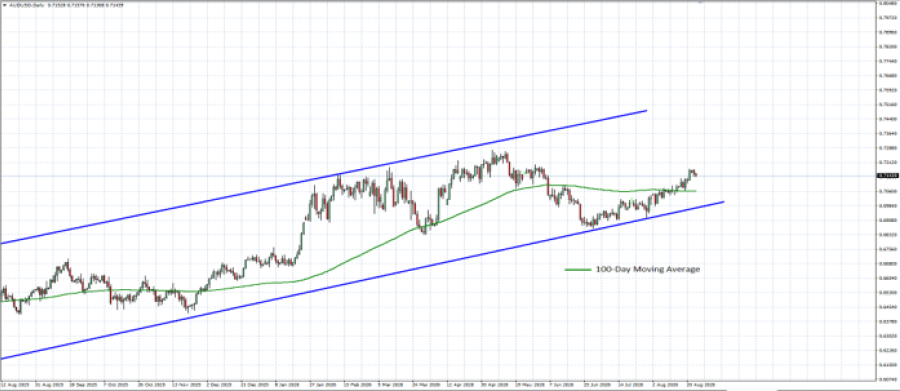
GRAPH (Daily): August 2025– August 2026
Please note that past performance does not guarantee future results.
AUD/USD, August 25, 2026
Current Price: 0.7150
|
AUD/USD |
Weekly |
|
Market Trend |
|
|
0.7700 |
|
|
0.7440 |
|
|
0.7250 |
|
|
0.7060 |
|
|
0.7020 |
|
|
0.7000 |
Example of calculation based on weekly market trend for 1.00 Lot1
|
AUD/USD |
||||||
|
Pivot Points |
||||||
|
Profit or loss in $ |
5,500 |
2,900 |
1,000 |
-900 |
-1,300 |
-1,500 |
|
Profit or loss in €² |
4,711 |
2,484 |
857 |
-771 |
-1,114 |
-1,285 |
|
Profit or loss in £² |
4,030 |
2,125 |
733 |
-659 |
-953 |
-1,099 |
|
Profit or loss in C$² |
7,620 |
4,018 |
1,386 |
-1,247 |
-1,801 |
-2,078 |
- The above calculations are made based on 1.00 lot which is equivalent of 100,000 units
- Calculations for exchange rate used as of 10:30 (GMT+1) 25/08/2026
You can use risk management tools such as Stop-Loss and Take-Profit.


