CFDs are complex instruments and come with a high risk of losing money rapidly due to leverage. 71% of retail investor accounts lose money when trading CFDs with this provider. You should consider whether you understand how CFDs work and whether you can afford to take the high risk of losing your money.
CFDs are complex instruments and come with a high risk of losing money rapidly due to leverage. 70.91% of retail investor accounts lose money when trading CFDs with this provider. You should consider whether you understand how CFDs work and whether you can afford to take the high risk of losing all your money. Read full risk warning.

Crude Oil Analysis

US Session Analysis for CFD Instruments 31/08/2021

Fundamental analysis

31 August, 2021

Oil prices slipped on Tuesday amid concerns that power outages and flooding in Louisiana after Hurricane Ida will cut crude demand from refineries at the same time global producers plan to raise output. prices were also weighed down by weaker manufacturing data from China, where factory activity expanded at a slower pace in August compared with the previous month. With “catastrophic” damage to the grid in Louisiana, power outages could last three weeks, utility officials said, which would slow efforts to repair and restart energy facilities. On the supply side, about 1.72 million bpd of oil production and 2.01 million cubic feet per day of natural gas output remained offline in the U.S. side of the Gulf of Mexico following evacuations at 288 platforms. Also keeping a lid on oil prices is the prospect that the Organization of the Petroleum Exporting Countries (OPEC) and allies, together known as OPEC+, will agree to go ahead with plans to add another 400,000 bpd of supply each month through December.
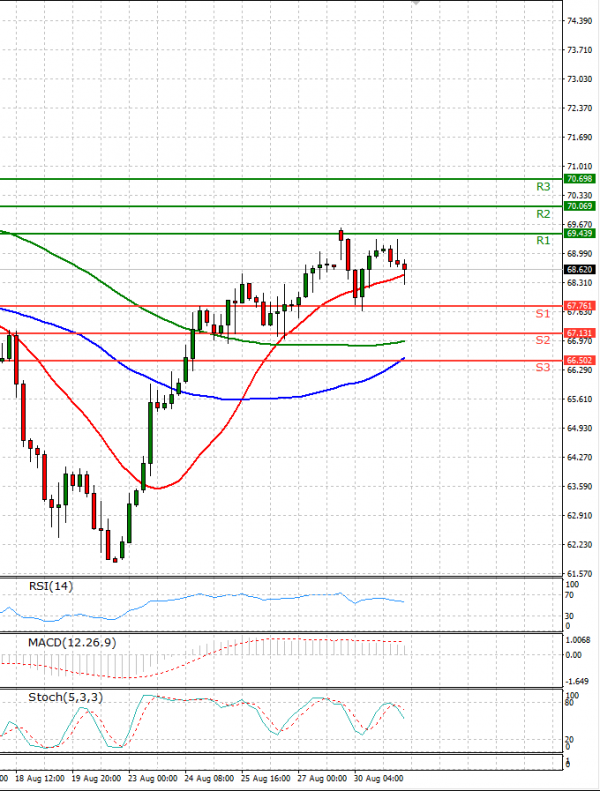
Technical analysis

Crude Oil Analysis Technical analysis 31/08/2021
Time Frame: 1 hour

CRUDEOIL Support & Resistance Table - 31/08/2021

Support & Resistance Level Explanation
Resistance 2 70.069 Daily R2
Resistance 1 69.439 Daily R1
Support 1 67.761 Daily S1
Support 2 67.131 Daily S2

CRUDEOIL Indicator Table - 31/08/2021

Indicator Signal
SMA 20 Buy
SMA 50 Buy
SMA 100 Buy
MACD( 12;26;9) Buy
RSI (14) Buy
Stochastic ( 9;6;3) Buy

CRUDEOIL Indicator / Period Table - 31/08/2021

Indicator / Period Day - BuyWeek - BuyMonth - Buy
MACD( 12;26;9) Buy SellBuy
RSI (14) Buy BuyBuy
SMA 20 Buy BuyBuy

CRUDEOIL 31/08/2021 - Reference Price : 68.600

Buy
Simple Moving AverageBuy (3)Sell (0)
Technical Indicators - OscillatorsBuy (3)Sell (0)
Share It With Your Network
Crude OIL Chart
Update Time: -
Highest
Lowest
1M 5M H D W
Prices are loading..
Ready for trading?Start Now