CFDs are complex instruments and come with a high risk of losing money rapidly due to leverage. 71% of retail investor accounts lose money when trading CFDs with this provider. You should consider whether you understand how CFDs work and whether you can afford to take the high risk of losing your money.
CFDs are complex instruments and come with a high risk of losing money rapidly due to leverage. 70.91% of retail investor accounts lose money when trading CFDs with this provider. You should consider whether you understand how CFDs work and whether you can afford to take the high risk of losing all your money. Read full risk warning.

Gold - Usd Dollar Analysis

US Session Analysis for CFD Instruments 31/08/2021

Fundamental analysis

31 August, 2021

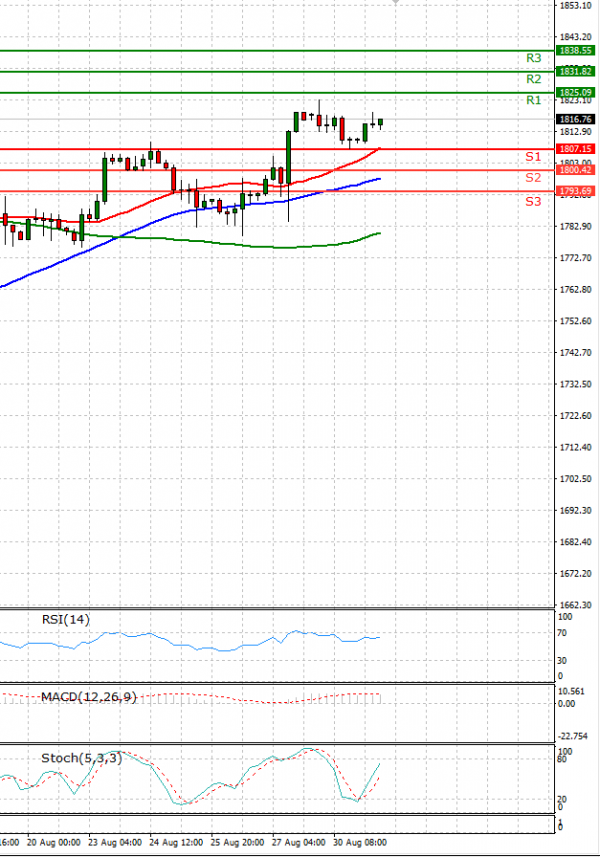
Gold prices rose back towards the previous session’s four-week high on Tuesday, supported by a weaker dollar and a fall in U.S. Treasury yields, as investors awaited August U.S. non-farm payrolls data due later this week. Making gold less expensive for other currency holders, the dollar index slipped to a more than three-week low. The benchmark U.S. 10-year yield fell to a one-week low. Following dovish remarks from Federal Reserve chief Jerome Powell at the Jackson Hole symposium last week, the spotlight shifts to Friday’s U.S. jobs report, which could shed more light on the Fed’s tapering strategy. The market is expecting an increase of 728,000 jobs, unemployment to fall to 5.2% from 5.4%, and average hourly earnings to rise 0.4% month-on-month.

Technical analysis

Gold - Usd Dollar Analysis Technical analysis 31/08/2021
Time Frame: 1 hour

GOLD Support & Resistance Table - 31/08/2021

Support & Resistance Level Explanation
Resistance 2 1831.82 Daily R2
Resistance 1 1825.09 Daily R1
Support 1 1807.15 Daily S1
Support 2 1800.42 Daily S2

GOLD Indicator Table - 31/08/2021

Indicator Signal
SMA 20 Buy
SMA 50 Buy
SMA 100 Buy
MACD( 12;26;9) Buy
RSI (14) Buy
Stochastic ( 9;6;3) Neutral

GOLD Indicator / Period Table - 31/08/2021

Indicator / Period Day - BuyWeek - BuyMonth - Buy
MACD( 12;26;9) Buy BuySell
RSI (14) Buy BuyBuy
SMA 20 Buy BuyBuy

GOLD 31/08/2021 - Reference Price : 1816.12

Buy
Simple Moving AverageBuy (3)Sell (0)
Technical Indicators - OscillatorsBuy (2)Sell (0)
Share It With Your Network
GOLD Chart
Update Time: -
Highest
Lowest
1M 5M H D W
Prices are loading..
Ready for trading?Start Now