Fortrade Canada Ltd. as an order-execution only dealer is not permitted to provide you with any advice or recommendations. These Market Commentaries should not be construed as a recommendation, advice or any attempt by Fortrade Canada Ltd. to prompt or influence you in making an investment decision to purchase, sell, hold or exchange any security or to influence the timing of such activity. This content is produced by Fortrade Limited which is not registered in any capacity with any securities regulatory authority in Canada.
71% of retail investor accounts lose money when trading CFDs with this provider.
CFDs are complex instruments and come with a high risk of losing money rapidly due to leverage. 71% of retail investor accounts lose money when trading CFDs with this provider. You should consider whether you understand how CFDs work and whether you can afford to take the high risk of losing your money.
70.91% of retail investor accounts lose money when trading CFDs with this provider.
CFDs are complex instruments and come with a high risk of losing money rapidly due to leverage. 70.91% of retail investor accounts lose money when trading CFDs with this provider. You should consider whether you understand how CFDs work and whether you can afford to take the high risk of losing all your money. Read full risk warning.
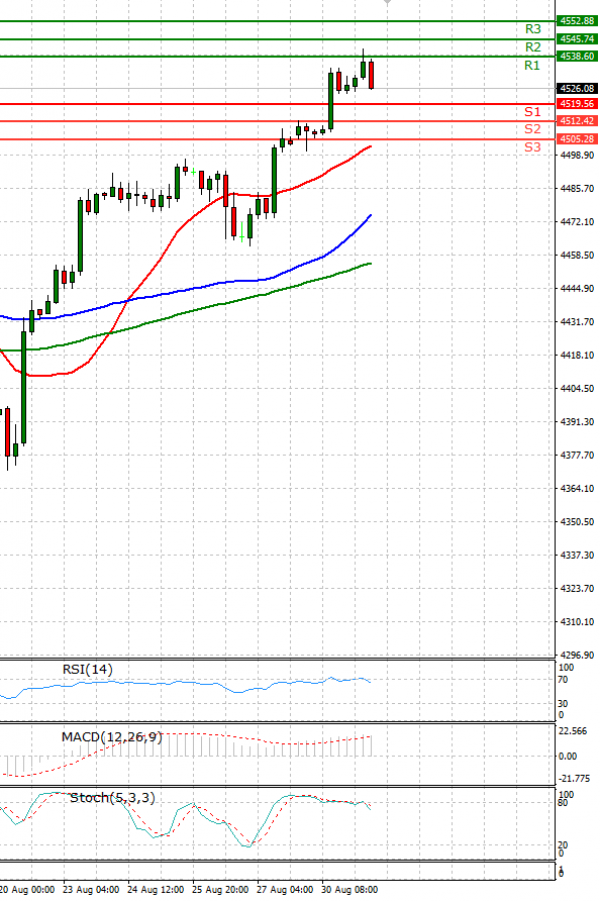
US Session Analysis for CFD Instruments 31/08/2021
Fundamental analysis
31 August, 2021
U.S. stock futures edged higher Tuesday, suggesting that the S&P 500 is on course for a third consecutive record close, ahead of data on U.S. consumer confidence levels. Futures tied to the S&P 500 ticked up 0.3% a day after the broad index closed at an all-time high. Dow Jones Industrial Average futures added 0.2% Tuesday while technology-heavy Nasdaq-100 futures rose 0.4%. Stocks have powered higher since Federal Reserve Chairman Jerome Powell reiterated Friday that the timing of scaling back on bond purchases—which is likely to begin later this year—won’t have any bearing on subsequent decisions to raise interest rates. Meanwhile, concerns about the elevated number of Covid-19 cases are providing a lift to technology stocks because investors are renewing bets on companies that would benefit from lockdowns and people working from home.