Fortrade Canada Ltd. as an order-execution only dealer is not permitted to provide you with any advice or recommendations. These Market Commentaries should not be construed as a recommendation, advice or any attempt by Fortrade Canada Ltd. to prompt or influence you in making an investment decision to purchase, sell, hold or exchange any security or to influence the timing of such activity. This content is produced by Fortrade Limited which is not registered in any capacity with any securities regulatory authority in Canada.
71% of retail investor accounts lose money when trading CFDs with this provider.
CFDs are complex instruments and come with a high risk of losing money rapidly due to leverage. 71% of retail investor accounts lose money when trading CFDs with this provider. You should consider whether you understand how CFDs work and whether you can afford to take the high risk of losing your money.
70.41% of retail investor accounts lose money when trading CFDs with this provider.
CFDs are complex instruments and come with a high risk of losing money rapidly due to leverage. 70.41% of retail investor accounts lose money when trading CFDs with this provider. You should consider whether you understand how CFDs work and whether you can afford to take the high risk of losing all your money. Read full risk warning.
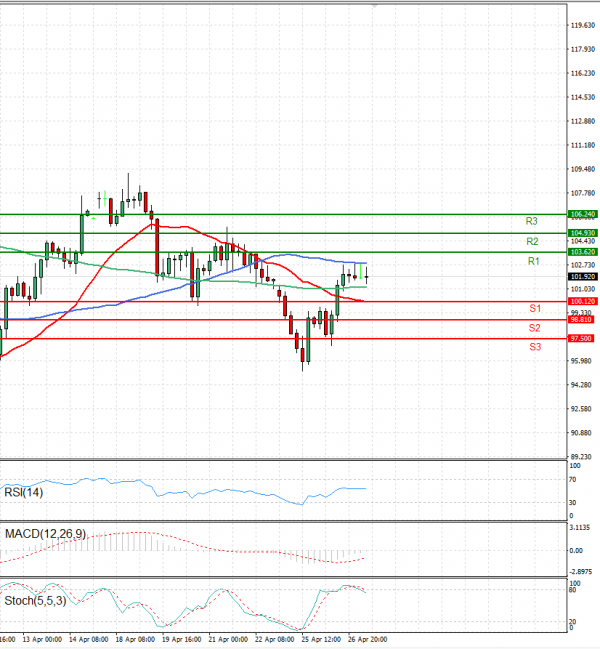
US Session Analysis for CFD Instruments 27/04/2022
Fundamental analysis
27 April, 2022
During most of European trade, the price of crude oil slowed, leaving earlier gains. Russia has decided to suspend natural gas deliveries to Poland and Bulgaria because the two countries did not pay their bills in rubles. The American Petroleum Institute announced last night that the stocks of crude oil in the USA increased by 4.78 million barrels. At around 13:00, crude oil was trading at $ 101.95 per barrel, an increase of 0.01% since the start of trading tonight. At 4:30 p.m. an official government report will be released on the state of crude oil and petroleum products in the United States.