CFDs are complex instruments and come with a high risk of losing money rapidly due to leverage. 71% of retail investor accounts lose money when trading CFDs with this provider. You should consider whether you understand how CFDs work and whether you can afford to take the high risk of losing your money.
CFDs are complex instruments and come with a high risk of losing money rapidly due to leverage. 70.41% of retail investor accounts lose money when trading CFDs with this provider. You should consider whether you understand how CFDs work and whether you can afford to take the high risk of losing all your money. Read full risk warning.

Gold - Usd Dollar Analysis

US Session Analysis for CFD Instruments 27/04/2022

Fundamental analysis

27 April, 2022

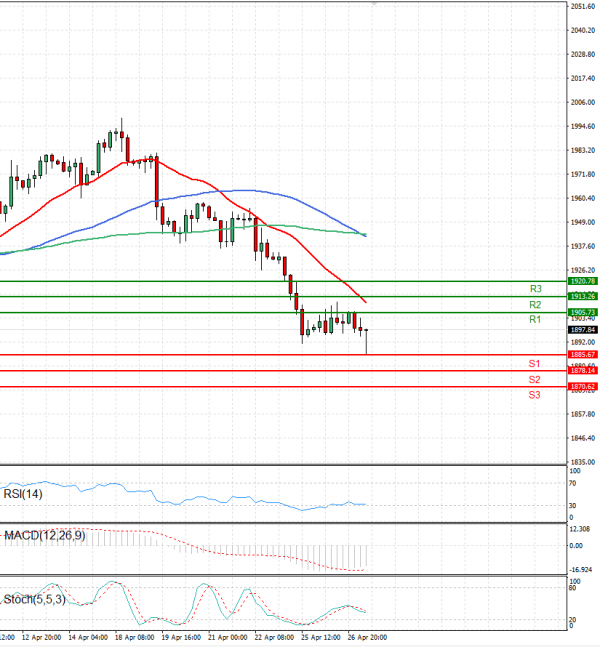
During most of the European trade, the price of gold is at the level of this morning. Jerome Powell, chairman of the US Federal Reserve, said last week that he was in favor of raising the interest rate by half a percent, which, until recently, was not the case. There is also speculation that the Fed, at least according to the efforts of a number of decision-makers, could, at the next meeting on May 5, increase the interest rate by as much as 0.75% (which is less certain). That, along with the further growth of yields on long-term US bonds, keeps (currently) pulling the price of gold down. On the other hand, the International Monetary Fund, however, announced the day before yesterday that it expects much higher price inflation in the world, both this year and next. Last week, it was announced that the consumer price index (inflation) in the US, in March, rose 8.5% year on year (expected + 8.4%). Also, inflation is growing faster in the UK. At around 13:00, the price of gold is trading at around 1898 dollars per fine ounce, which represents a price drop of 0.43% since the close of trading on Friday.

Technical analysis

Gold - Usd Dollar Analysis Technical analysis 27/04/2022
Time Frame: 1 hour

GOLD Support & Resistance Table - 27/04/2022

Support & Resistance Level Explanation
Resistance 2 1913.26 Daily R2
Resistance 1 1905.73 Daily R1
Support 1 1885.67 Daily S1
Support 2 1878.14 Daily S2

GOLD Indicator Table - 27/04/2022

Indicator Signal
SMA 20 Sell
SMA 50 Sell
SMA 100 Sell
MACD( 12;26;9) Sell
RSI (14) Neutral
Stochastic ( 9;6;3) Sell

GOLD Indicator / Period Table - 27/04/2022

Indicator / Period Day - SellWeek - BuyMonth - Buy
MACD( 12;26;9) Sell BuyBuy
RSI (14) Neutral NeutralBuy
SMA 20 Sell BuyBuy

GOLD 27/04/2022 - Reference Price : 1897.84

Sell
Simple Moving AverageBuy (0)Sell (3)
Technical Indicators - OscillatorsBuy (0)Sell (2)
Share It With Your Network
GOLD Chart
Update Time: -
Highest
Lowest
1M 5M H D W
Prices are loading..
Ready for trading?Start Now