Fortrade Canada Ltd. as an order-execution only dealer is not permitted to provide you with any advice or recommendations. These Market Commentaries should not be construed as a recommendation, advice or any attempt by Fortrade Canada Ltd. to prompt or influence you in making an investment decision to purchase, sell, hold or exchange any security or to influence the timing of such activity. This content is produced by Fortrade Limited which is not registered in any capacity with any securities regulatory authority in Canada.
71% of retail investor accounts lose money when trading CFDs with this provider.
CFDs are complex instruments and come with a high risk of losing money rapidly due to leverage. 71% of retail investor accounts lose money when trading CFDs with this provider. You should consider whether you understand how CFDs work and whether you can afford to take the high risk of losing your money.
70.41% of retail investor accounts lose money when trading CFDs with this provider.
CFDs are complex instruments and come with a high risk of losing money rapidly due to leverage. 70.41% of retail investor accounts lose money when trading CFDs with this provider. You should consider whether you understand how CFDs work and whether you can afford to take the high risk of losing all your money. Read full risk warning.
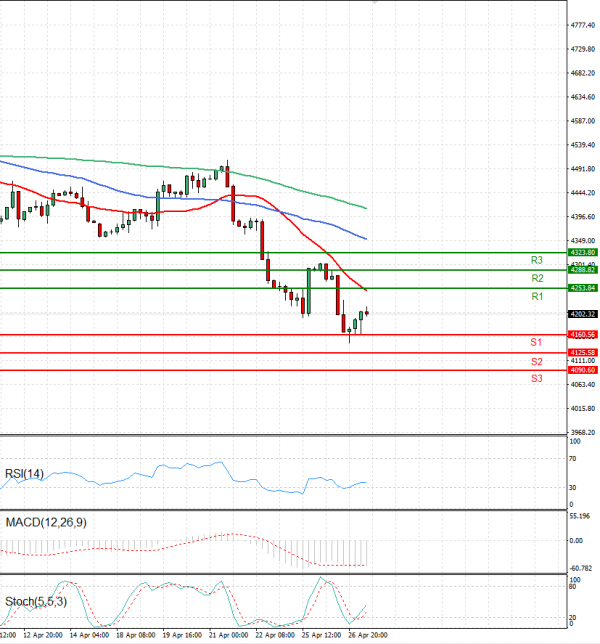
US Session Analysis for CFD Instruments 27/04/2022
Fundamental analysis
27 April, 2022
At the beginning of trading in New York, futures on this index (subject to trading on the MT4 platform) recorded a growth of 0.91%. By the way, US stock indexes fell sharply on Tuesday. The Dow Jones conceded 809 points, while the S&P500 closed at 4,175.2 points, down 2.18%. Nasdaq fell 3.95%. Since the beginning of the year, the index has fallen 12.4%. Pfizer (+ 0.16%) and Exxon Mobil (+ 0.04%) stood out from the winners, and Tesla (-12.18%) and Apple (-3.73%) from the losers. The earnings season is heating up and today business and financial results are expected from Meta platforms (ex-Facebook). Alphabet (Google) was disappointing yesterday and Microsoft has extremely positively surprised.