CFDs are complex instruments and come with a high risk of losing money rapidly due to leverage. 71% of retail investor accounts lose money when trading CFDs with this provider. You should consider whether you understand how CFDs work and whether you can afford to take the high risk of losing your money.
CFDs are complex instruments and come with a high risk of losing money rapidly due to leverage. 70.91% of retail investor accounts lose money when trading CFDs with this provider. You should consider whether you understand how CFDs work and whether you can afford to take the high risk of losing all your money. Read full risk warning.

Crude Oil Analysis

US Session Analysis for CFD Instruments 10/06/2024

Fundamental analysis

10 June, 2024

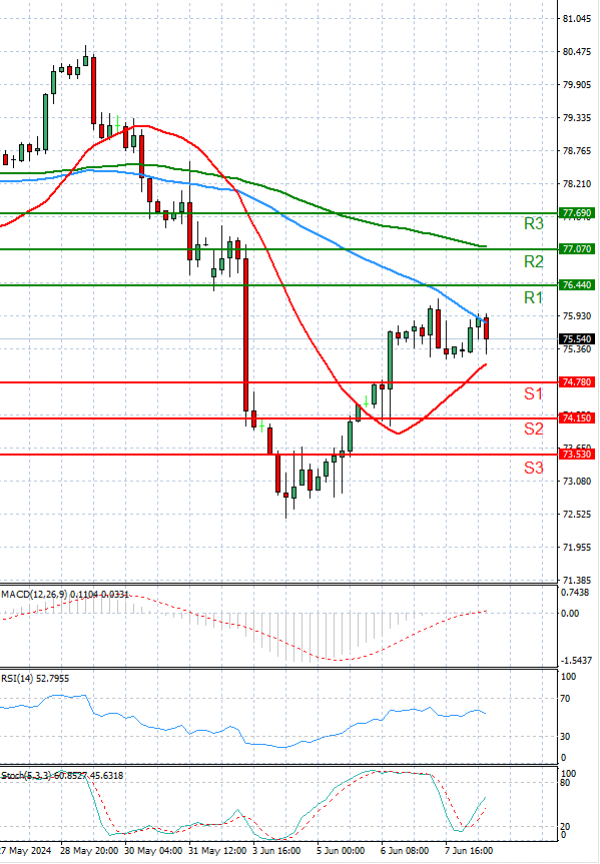
Crude Oil is trading today in the European session above the $75 level.

In European trading on Monday, oil prices experienced a modest increase, stabilising following three consecutive weeks of declines. Traders were eagerly anticipating signals regarding U.S. interest rates and the forthcoming OPEC report.

Last week, crude oil prices had dropped due to a strengthened dollar, driven by unexpectedly robust nonfarm payrolls data. Low trading volumes were observed due to market holidays in China, Australia, and Hong Kong.

The upcoming OPEC report, scheduled for release on Tuesday, will be closely monitored for insights into annual oil demand forecasts.

Technical analysis

Crude Oil Analysis Technical analysis 10/06/2024
Time Frame: 1 hour

CRUDEOIL Support & Resistance Table - 10/06/2024

Support & Resistance Level Explanation
Resistance 2 77.07 Daily R2
Resistance 1 76.44 Daily R1
Support 1 74.78 Daily S1
Support 2 74.15 Daily S2

CRUDEOIL Indicator Table - 10/06/2024

Indicator Signal
SMA 20 Buy
SMA 50 Buy
SMA 100 Sell
MACD( 12;26;9) Buy
RSI (14) Buy
Stochastic ( 9;6;3) Buy

CRUDEOIL Indicator / Period Table - 10/06/2024

Indicator / Period Day - BuyWeek - SellMonth - Sell
MACD( 12;26;9) Buy SellBuy
RSI (14) Buy SellSell
SMA 20 Buy SellSell

CRUDEOIL 10/06/2024 - Reference Price : 75.61

Buy
Simple Moving AverageBuy (2)Sell (1)
Technical Indicators - OscillatorsBuy (3)Sell (0)
Share It With Your Network
Crude OIL Chart
Update Time: -
Highest
Lowest
1M 5M H D W
Prices are loading..
Ready for trading?Start Now