CFDs are complex instruments and come with a high risk of losing money rapidly due to leverage. 71% of retail investor accounts lose money when trading CFDs with this provider. You should consider whether you understand how CFDs work and whether you can afford to take the high risk of losing your money.
CFDs are complex instruments and come with a high risk of losing money rapidly due to leverage. 70.91% of retail investor accounts lose money when trading CFDs with this provider. You should consider whether you understand how CFDs work and whether you can afford to take the high risk of losing all your money. Read full risk warning.

Gold - Usd Dollar Analysis

US Session Analysis for CFD Instruments 10/06/2024

Fundamental analysis

10 June, 2024

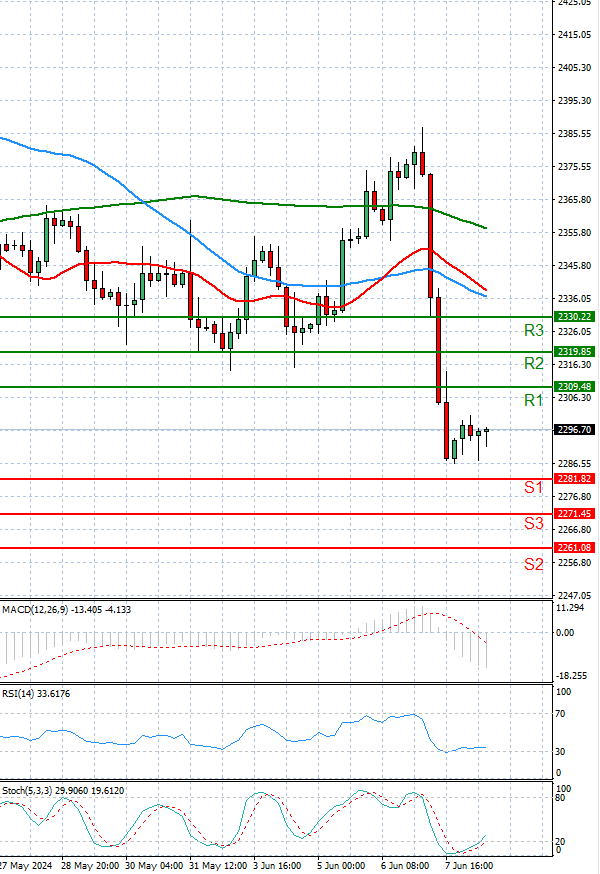
Gold prices are trading in today’s European session around 2300 levels.

Gold prices stayed stagnant or slightly declined during European trading on Monday, bouncing back from the significant drops experienced last week.

These declines were attributed to concerns over anticipated increases in U.S. interest rates prior to the Federal Reserve meeting and crucial inflation figures.

Following unexpectedly high nonfarm payrolls data on Friday, the metal experienced a sharp decline from its near-record highs, prompting traders to reassess their predictions regarding a rate cut in September.

Investors are now eagerly awaiting the U.S. Consumer Price Index (CPI) data and the Federal Reserve meeting on Wednesday for further guidance.

Technical analysis

Gold - Usd Dollar Analysis Technical analysis 10/06/2024
Time Frame: 1 hour

GOLD Support & Resistance Table - 10/06/2024

Support & Resistance Level Explanation
Resistance 2 2319.85 Daily R2
Resistance 1 2309.48 Daily R1
Support 1 2281.82 Daily S1
Support 2 2271.45 Daily S2

GOLD Indicator Table - 10/06/2024

Indicator Signal
SMA 20 Sell
SMA 50 Sell
SMA 100 Sell
MACD( 12;26;9) Sell
RSI (14) Sell
Stochastic ( 9;6;3) Sell

GOLD Indicator / Period Table - 10/06/2024

Indicator / Period Day - SellWeek - SellMonth - Buy
MACD( 12;26;9) Sell SellBuy
RSI (14) Sell SellBuy
SMA 20 Sell SellBuy

GOLD 10/06/2024 - Reference Price : 2295.65

Sell
Simple Moving AverageBuy (0)Sell (3)
Technical Indicators - OscillatorsBuy (0)Sell (3)
Share It With Your Network
GOLD Chart
Update Time: -
Highest
Lowest
1M 5M H D W
Prices are loading..
Ready for trading?Start Now