CFDs are complex instruments and come with a high risk of losing money rapidly due to leverage. 71% of retail investor accounts lose money when trading CFDs with this provider. You should consider whether you understand how CFDs work and whether you can afford to take the high risk of losing your money.
CFDs are complex instruments and come with a high risk of losing money rapidly due to leverage. 70.91% of retail investor accounts lose money when trading CFDs with this provider. You should consider whether you understand how CFDs work and whether you can afford to take the high risk of losing all your money. Read full risk warning.

Ger 40 Index Analysis

US Session Analysis for CFD Instruments 10/06/2024

Fundamental analysis

10 June, 2024

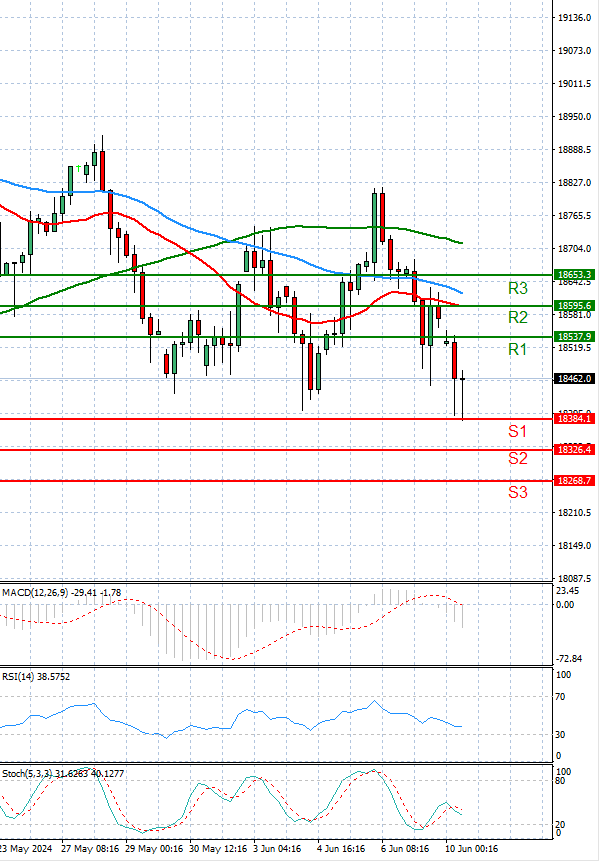
In the European session, the German Benchmark Index traded below 18,500 levels.

European stock markets declined on Monday, influenced by the outcome of the European Parliament election, which saw gains for nationalist and euro-sceptic parties.

The DAX index in Germany dropped by 0.8%, the CAC 40 in France fell by 1.9%, and the FTSE 100 in the U.K. decreased by 0.7%.

The European elections' results dampened sentiment, particularly after the shift to the right and the increased representation of eurosceptic nationalists. French President Emmanuel Macron responded by announcing snap legislative elections later this month following a strong performance by Marine Le Pen's far-right party.

This rise in right-wing influence may lead to a more divided European parliament, potentially complicating the passage of EU legislation on various issues such as climate, immigration, industrial strategy, and defence.

Technical analysis

Ger 40 Index Analysis Technical analysis 10/06/2024
Time Frame: 1 hour

GER40 Support & Resistance Table - 10/06/2024

Support & Resistance Level Explanation
Resistance 2 18595.6 Daily R2
Resistance 1 18537.9 Daily R1
Support 1 18384.1 Daily S1
Support 2 18326.4 Daily S2

GER40 Indicator Table - 10/06/2024

Indicator Signal
SMA 20 Sell
SMA 50 Sell
SMA 100 Sell
MACD( 12;26;9) Buy
RSI (14) Sell
Stochastic ( 9;6;3) Sell

GER40 Indicator / Period Table - 10/06/2024

Indicator / Period Day - SellWeek - SellMonth - Buy
MACD( 12;26;9) Buy BuyBuy
RSI (14) Sell SellBuy
SMA 20 Buy SellBuy

GER40 10/06/2024 - Reference Price : 18461.0

Sell
Simple Moving AverageBuy (0)Sell (3)
Technical Indicators - OscillatorsBuy (1)Sell (2)
Share It With Your Network
Ger40 Chart
Update Time: -
Highest
Lowest
1M 5M H D W
Prices are loading..
Ready for trading?Start Now