CFDs are complex instruments and come with a high risk of losing money rapidly due to leverage. 71% of retail investor accounts lose money when trading CFDs with this provider. You should consider whether you understand how CFDs work and whether you can afford to take the high risk of losing your money.
CFDs are complex instruments and come with a high risk of losing money rapidly due to leverage. 70.91% of retail investor accounts lose money when trading CFDs with this provider. You should consider whether you understand how CFDs work and whether you can afford to take the high risk of losing all your money. Read full risk warning.

USA500 Analysis

US Session Analysis for CFD Instruments 10/06/2024

Fundamental analysis

10 June, 2024

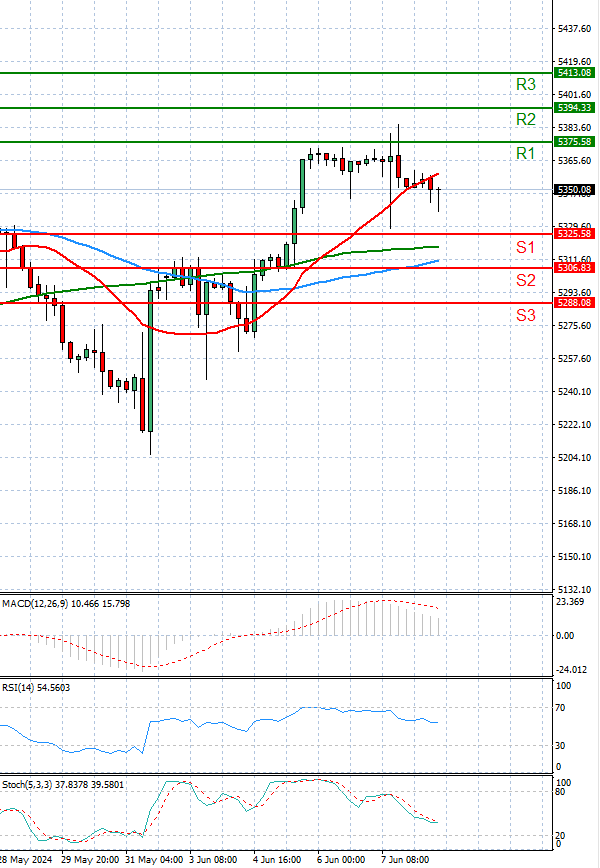
The USA500 is currently trading below 5,400 levels.

On Monday, U.S. stock futures indicated a downward trend as investors awaited significant events later in the week, including a key Federal Reserve interest rate decision and crucial monthly inflation data.

The Dow futures contract declined by 87 points or 0.2%, S&P 500 futures slipped by 6 points or 0.1%, and Nasdaq 100 futures edged down by 43 points or 0.3%.

Wall Street's major averages experienced declines in the previous session amidst volatile trading, largely influenced by a jobs report that surpassed expectations. This heightened concerns that the Federal Reserve might postpone potential rate cuts for a longer duration than anticipated by some investors.

Despite this, the S&P 500, Nasdaq Composite, and Dow Jones Industrial Average managed to register weekly gains.

Technical analysis

USA500 Analysis Technical analysis 10/06/2024
Time Frame: 1 hour

USA500 Support & Resistance Table - 10/06/2024

Support & Resistance Level Explanation
Resistance 2 5394.33 Daily R2
Resistance 1 5375.58 Daily R1
Support 1 5325.58 Daily S1
Support 2 5306.83 Daily S2

USA500 Indicator Table - 10/06/2024

Indicator Signal
SMA 20 Sell
SMA 50 Buy
SMA 100 Buy
MACD( 12;26;9) Buy
RSI (14) Buy
Stochastic ( 9;6;3) Sell

USA500 Indicator / Period Table - 10/06/2024

Indicator / Period Day - BuyWeek - BuyMonth - Buy
MACD( 12;26;9) Buy BuyBuy
RSI (14) Buy BuyBuy
SMA 20 Sell BuyBuy

USA500 10/06/2024 - Reference Price : 5350.58

Buy
Simple Moving AverageBuy (2)Sell (1)
Technical Indicators - OscillatorsBuy (2)Sell (1)
Share It With Your Network
USA500 Chart
Update Time: -
Highest
Lowest
1M 5M H D W
Prices are loading..
Ready for trading?Start Now