Fortrade Canada Ltd. as an order-execution only dealer is not permitted to provide you with any advice or recommendations. These Market Commentaries should not be construed as a recommendation, advice or any attempt by Fortrade Canada Ltd. to prompt or influence you in making an investment decision to purchase, sell, hold or exchange any security or to influence the timing of such activity. This content is produced by Fortrade Limited which is not registered in any capacity with any securities regulatory authority in Canada.
70% of retail investor accounts lose money when trading CFDs with this provider.
CFDs are complex instruments and come with a high risk of losing money rapidly due to leverage. 70% of retail investor accounts lose money when trading CFDs with this provider. You should consider whether you understand how CFDs work and whether you can afford to take the high risk of losing your money.
70.41% of retail investor accounts lose money when trading CFDs with this provider.
CFDs are complex instruments and come with a high risk of losing money rapidly due to leverage. 70.41% of retail investor accounts lose money when trading CFDs with this provider. You should consider whether you understand how CFDs work and whether you can afford to take the high risk of losing all your money. Read full risk warning.
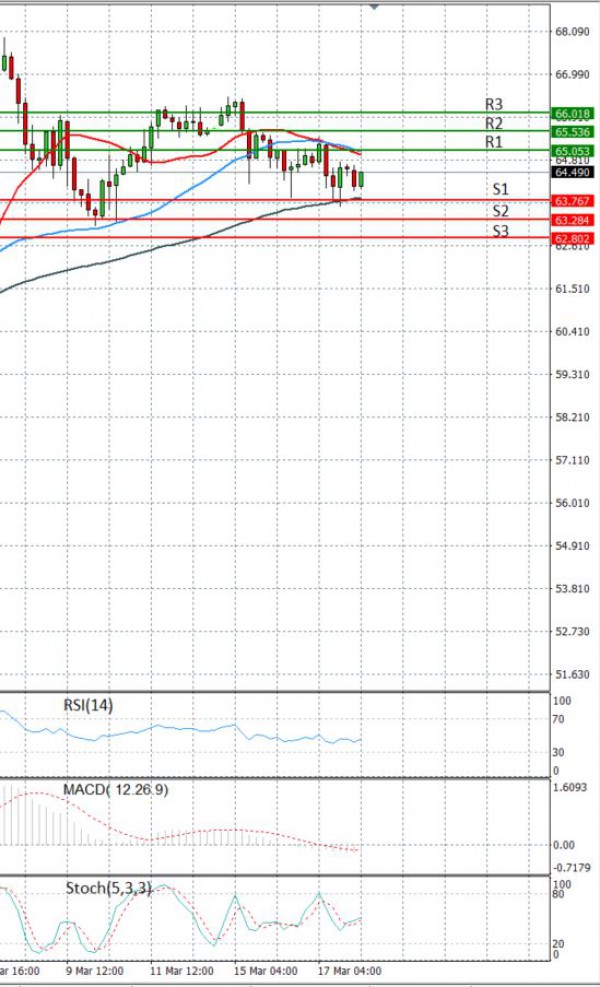
EU Session Analysis for CFD Instruments 18/03/2021
Fundamental analysis
18 March, 2021
Oil prices dropped for a fifth day on Thursday after official data showed a sustained rise in U.S. crude and fuel inventories, while the ever-present pandemic clouded the demand outlook. Government data on Wednesday showed U.S. crude inventories have risen for four straight weeks after refineries in the south were forced to shut due to severe cold weather. An industry report estimating a 1 million barrel-drop had raised hopes the run of gains might have stopped. U.S. crude inventories increased by 2.4 million barrels last week, an industry report on Tuesday estimated a 1 million barrel-decline. Analysts had on average expected an increase of 3 million barrels. On the demand front, a number of European countries have halted use of AstraZeneca’s COVID-19 vaccine because of concerns about possible side effects. Germany is also seeing a rise in coronavirus cases, while Italy plans a national lockdown for Easter lockdown and France will introduce tougher restrictions.