Fortrade Canada Ltd. as an order-execution only dealer is not permitted to provide you with any advice or recommendations. These Market Commentaries should not be construed as a recommendation, advice or any attempt by Fortrade Canada Ltd. to prompt or influence you in making an investment decision to purchase, sell, hold or exchange any security or to influence the timing of such activity. This content is produced by Fortrade Limited which is not registered in any capacity with any securities regulatory authority in Canada.
70% of retail investor accounts lose money when trading CFDs with this provider.
CFDs are complex instruments and come with a high risk of losing money rapidly due to leverage. 70% of retail investor accounts lose money when trading CFDs with this provider. You should consider whether you understand how CFDs work and whether you can afford to take the high risk of losing your money.
70.41% of retail investor accounts lose money when trading CFDs with this provider.
CFDs are complex instruments and come with a high risk of losing money rapidly due to leverage. 70.41% of retail investor accounts lose money when trading CFDs with this provider. You should consider whether you understand how CFDs work and whether you can afford to take the high risk of losing all your money. Read full risk warning.
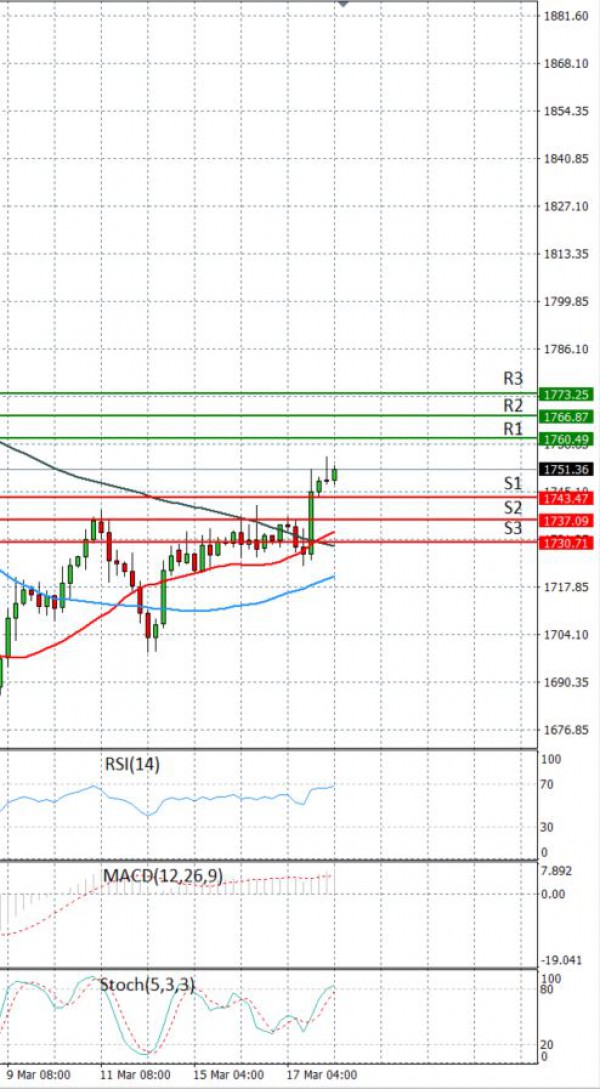
EU Session Analysis for CFD Instruments 18/03/2021
Fundamental analysis
18 March, 2021
Gold prices rose to a more than two-week high on Thursday after the U.S. Federal Reserve reaffirmed its stance to keep interest rate near zero until 2023, although the safe-haven metal's gains were capped by its forecast of a strong economic rebound. The U.S. economy was on track for its fastest expansion in nearly 40 years, the Fed said on Wednesday while reaffirming its ultra-easy monetary policy stance amid an expected, although temporary surge in inflation. Higher U.S. interest rates and Treasury bond yields raise the opportunity cost of holding non-yielding bullion. The dollar index slipped to a two-week low, while the benchmark U.S. Treasury yields held close to a more than one-year peak.