Fortrade Canada Ltd. as an order-execution only dealer is not permitted to provide you with any advice or recommendations. These Market Commentaries should not be construed as a recommendation, advice or any attempt by Fortrade Canada Ltd. to prompt or influence you in making an investment decision to purchase, sell, hold or exchange any security or to influence the timing of such activity. This content is produced by Fortrade Limited which is not registered in any capacity with any securities regulatory authority in Canada.
71% of retail investor accounts lose money when trading CFDs with this provider.
CFDs are complex instruments and come with a high risk of losing money rapidly due to leverage. 71% of retail investor accounts lose money when trading CFDs with this provider. You should consider whether you understand how CFDs work and whether you can afford to take the high risk of losing your money.
70.91% of retail investor accounts lose money when trading CFDs with this provider.
CFDs are complex instruments and come with a high risk of losing money rapidly due to leverage. 70.91% of retail investor accounts lose money when trading CFDs with this provider. You should consider whether you understand how CFDs work and whether you can afford to take the high risk of losing all your money. Read full risk warning.
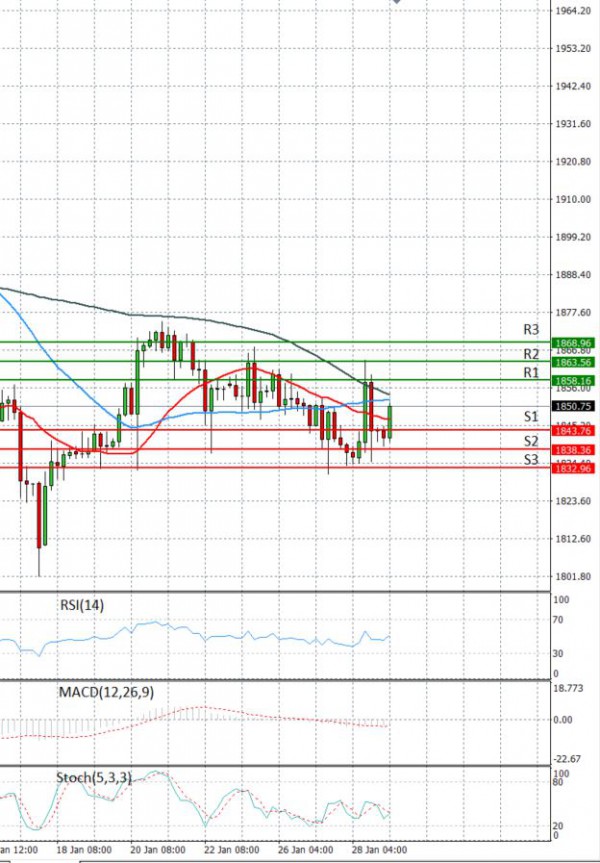
EU Session Analysis for CFD Instruments 29/01/2021
Fundamental analysis
29 January, 2021
Gold prices were range bound on Friday and on track to post a weekly and monthly decline as a stronger dollar dented the precious metal's appeal. The dollar rose 0.2%, making bullion expensive for holders of other currencies. The greenback has risen 0.8% this month helped by higher U.S. Treasury yields and concerns that President Joe Biden's fiscal spending package will not be as large as the proposed $1.9 trillion.Higher Treasury yields elevate demand for the dollar as it is used to buy bonds. Investors remain focussed on the U.S. stimulus deal as analysts warn that a smaller stimulus or delay in getting the aid passed could weigh on gold prices.