CFDs are complex instruments and come with a high risk of losing money rapidly due to leverage. 71% of retail investor accounts lose money when trading CFDs with this provider. You should consider whether you understand how CFDs work and whether you can afford to take the high risk of losing your money.
CFDs are complex instruments and come with a high risk of losing money rapidly due to leverage. 70.91% of retail investor accounts lose money when trading CFDs with this provider. You should consider whether you understand how CFDs work and whether you can afford to take the high risk of losing all your money. Read full risk warning.

USA500 Analysis

EU Session Analysis for CFD Instruments 29/01/2021

Fundamental analysis

29 January, 2021

U.S. stocks closed higher on Thursday, bouncing from sharp losses in the prior session, thanks to a broad rally as earnings season got off to a strong start and fears lessened around hedge funds selling long positions to cover shorts. Heavyweights, including Microsoft Corp, Amazon.com and Alphabet Inc, were among the biggest boosts to the S&P 500, a day after the three major U.S. indexes suffered their biggest daily percentage drop in three months. Apple reported holiday-quarter sales and profit that beat Wall Street expectations. However, shares of the iPhone maker fell 3.50% after climbing about 7% to start the year. With quarterly earnings season in full swing, market participants have looked to whether companies could justify high valuations, with the forward price-to-earnings ratio on the benchmark S&P index near 20-year highs. Fourth Quarter GDP in the United States came in at 4.0%, as expected. Initial Jobless Claims for the past week were 847,000, below the analysts’ forecast of 875,000.
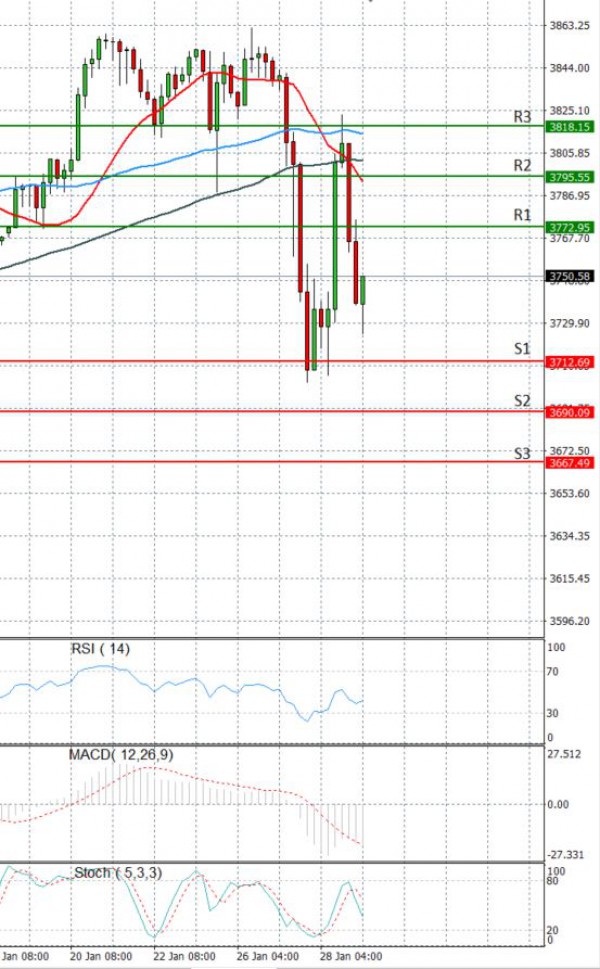
Technical analysis

USA500 Analysis Technical analysis 29/01/2021
Time Frame: 1 hour

USA500 Support & Resistance Table - 29/01/2021

Support & Resistance Level Explanation
Resistance 2 3795.55 Daily R2
Resistance 1 3772.95 Daily R1
Support 1 3712.69 Daily S1
Support 2 3690.09 Daily S2

USA500 Indicator Table - 29/01/2021

Indicator Signal
SMA 20 Sell
SMA 50 Sell
SMA 100 Sell
MACD( 12;26;9) Sell
RSI (14) Sell
Stochastic ( 9;6;3) Sell

USA500 Indicator / Period Table - 29/01/2021

Indicator / Period Day - SellWeek - SellMonth - Buy
MACD( 12;26;9) Sell BuyBuy
RSI (14) Sell SellBuy
SMA 20 Sell SellBuy

USA500 29/01/2021 - Reference Price : 3742.82

Sell
Simple Moving AverageBuy (0)Sell (3)
Technical Indicators - OscillatorsBuy (0)Sell (3)
Share It With Your Network
USA500 Chart
Update Time: -
Highest
Lowest
1M 5M H D W
Prices are loading..
Ready for trading?Start Now