Fortrade Canada Ltd. as an order-execution only dealer is not permitted to provide you with any advice or recommendations. These Market Commentaries should not be construed as a recommendation, advice or any attempt by Fortrade Canada Ltd. to prompt or influence you in making an investment decision to purchase, sell, hold or exchange any security or to influence the timing of such activity. This content is produced by Fortrade Limited which is not registered in any capacity with any securities regulatory authority in Canada.
71% of retail investor accounts lose money when trading CFDs with this provider.
CFDs are complex instruments and come with a high risk of losing money rapidly due to leverage. 71% of retail investor accounts lose money when trading CFDs with this provider. You should consider whether you understand how CFDs work and whether you can afford to take the high risk of losing your money.
70.91% of retail investor accounts lose money when trading CFDs with this provider.
CFDs are complex instruments and come with a high risk of losing money rapidly due to leverage. 70.91% of retail investor accounts lose money when trading CFDs with this provider. You should consider whether you understand how CFDs work and whether you can afford to take the high risk of losing all your money. Read full risk warning.
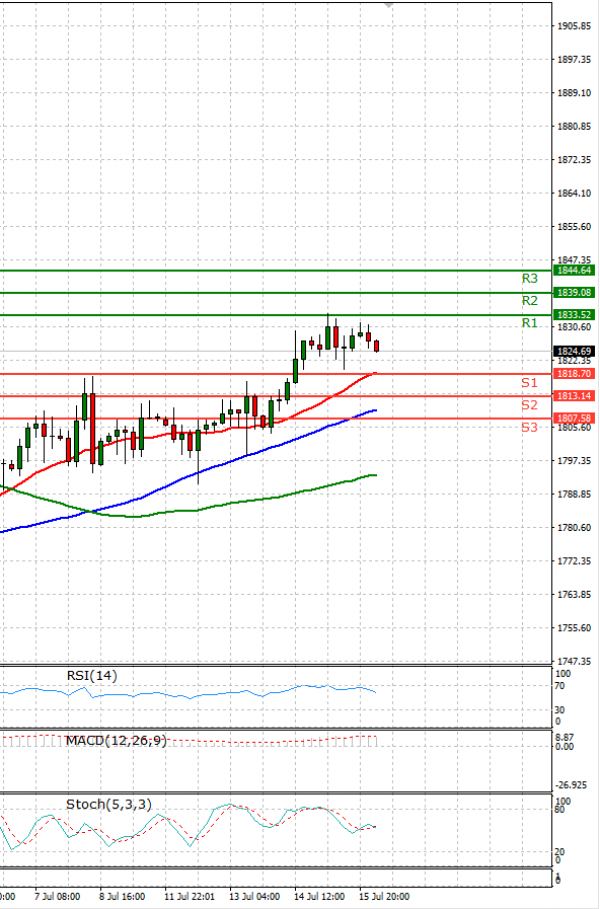
EU Session Analysis for CFD Instruments 16/07/2021
Fundamental analysis
16 July, 2021
Gold prices were headed on Friday for a fourth straight weekly gain after the U.S. Federal Reserve allayed investor fears of a faster tightening of monetary policy, though the safe-haven metal was subdued by pressure from a firmer dollar. However, gold is finding support from lower real rates and the fact that some elements of the market think the Fed is not really going to push the envelope for rate hikes, Innes added. Lower interest rates decrease the opportunity cost of holding non-yielding gold, also considered a hedge against inflation that could result from widespread stimulus measures.