Fortrade Canada Ltd. as an order-execution only dealer is not permitted to provide you with any advice or recommendations. These Market Commentaries should not be construed as a recommendation, advice or any attempt by Fortrade Canada Ltd. to prompt or influence you in making an investment decision to purchase, sell, hold or exchange any security or to influence the timing of such activity. This content is produced by Fortrade Limited which is not registered in any capacity with any securities regulatory authority in Canada.
71% of retail investor accounts lose money when trading CFDs with this provider.
CFDs are complex instruments and come with a high risk of losing money rapidly due to leverage. 71% of retail investor accounts lose money when trading CFDs with this provider. You should consider whether you understand how CFDs work and whether you can afford to take the high risk of losing your money.
70.91% of retail investor accounts lose money when trading CFDs with this provider.
CFDs are complex instruments and come with a high risk of losing money rapidly due to leverage. 70.91% of retail investor accounts lose money when trading CFDs with this provider. You should consider whether you understand how CFDs work and whether you can afford to take the high risk of losing all your money. Read full risk warning.
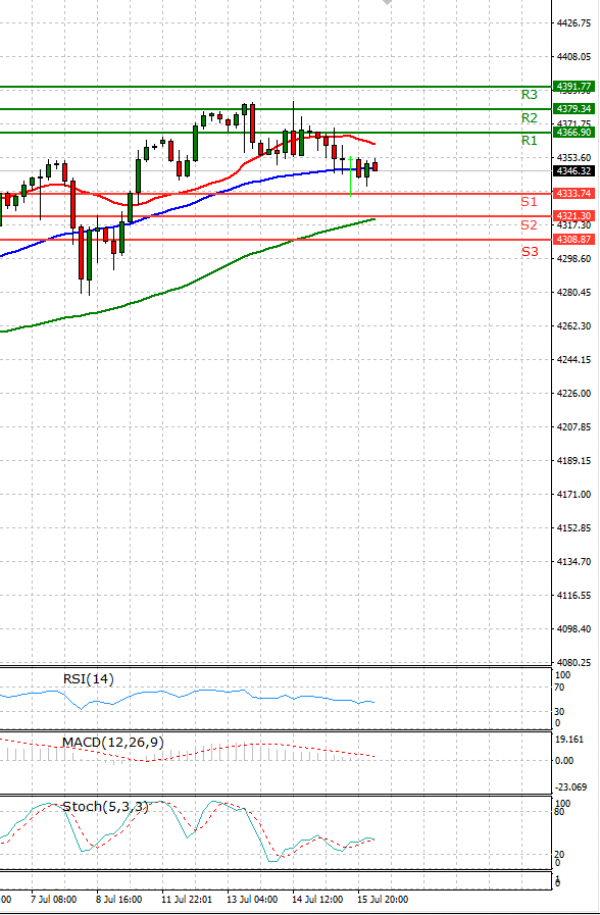
EU Session Analysis for CFD Instruments 16/07/2021
Fundamental analysis
16 July, 2021
The Nasdaq ended lower on Thursday, pulled down by Apple, Amazon and other Big Tech companies as a fall in weekly jobless claims data fed investor concerns about a recent inflation spike. Amazon, Apple Tesla and Facebook all fell. Nvidia tumbled around 4%. The S&P 500 technology sector index ended a four-day winning streak. Earlier this week, investors’ favor for heavyweight growth stocks pushed the S&P 500 and the Nasdaq to record highs. Fresh data showed the number of Americans filing new claims for unemployment benefits fell last week to a 16-month low, while worker shortages and bottlenecks in the supply chain have frustrated efforts by businesses to ramp up production to meet strong demand for goods and services. Federal Reserve Chair Jerome Powell told lawmakers he anticipated the shortages and high inflation would abate. Yet many investors still worry that more sustained inflation could lead to a sooner-than-expected tightening of monetary policy.