APPLE Weekly Special Report based on 1.00 Lot Calculation:
APPLE: ANALYSIS AND EVENTS
- APPLE is the most valuable company in the world and the first company ever to reach a market capitalization of 3 trillion dollars, which is almost equal to the Indian GDP of $3.5 trillion (the 5th largest economy in the world by GDP).
- PRODUCTS: iPhone (smartphones), iPad, Apple Watch, Mac and Apple TV.
SMARTPHONE MARKET SHARE:
1. Apple (iPhone): 30.44%
2. Samsung: 26.10%
3. Xiaomi: 11.72%
4. Huawei: 4.12%
5. Others: 27.62%
Source: GS Statcounter
SERVICES: Music, movies, TV shows, stickers and App purchases.
NEWS AND EVENTS
- EVENT: APPLE VISION PRO RELEASE (FEBRUARY 2, 2024): Apple Vision Pro is an upcoming mixed reality headset developed by Apple Inc. It was announced on June 5, 2023, at Apple's Worldwide Developers Conference, to launch on February 2nd, 2024 in the United States and later that year internationally.
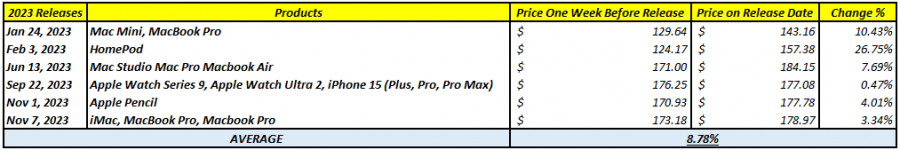
Source: MT4 Platform
Please note that past performance does not guarantee future results.
- EVENT: Q4 2023 EARNINGS RELEASE (EXPECTED: FEBRUARY 2, 2024 (Bloomberg)): Historically, Apple's Q4 Earnings Releases have consistently exhibited remarkable positivity, with an upward trend since 2018. On average, the company has witnessed a substantial 45.66% increase in revenue (Source: Bloomberg) compared to the previous quarter, highlighting its robust performance and strong market position during the year-end period.
Historically the company has beat their Earnings and Revenue estimates 7 out of the last 8 times (87.5% probability) (Source: Bloomberg)
Please note that past performance does not guarantee future results.
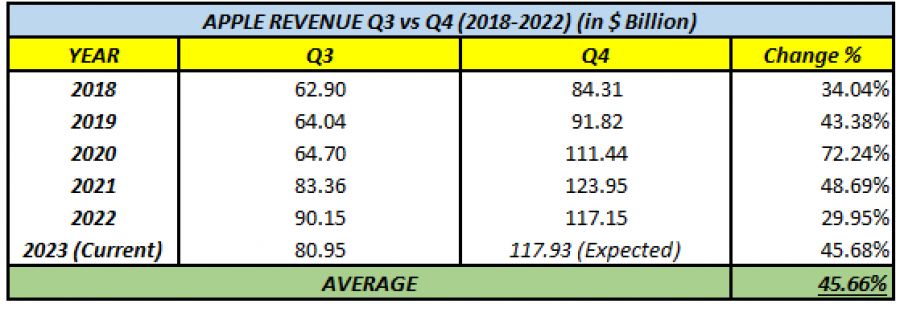
Source: Bloomberg
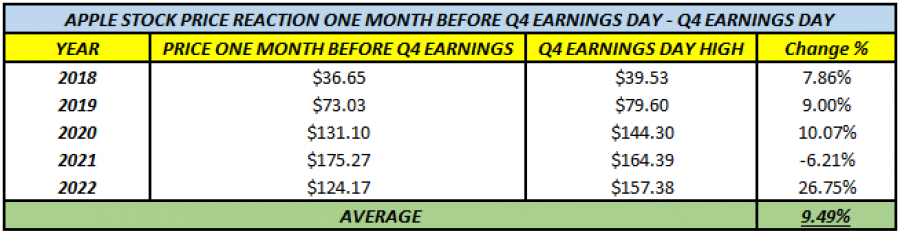
Source: Bloomberg and MT4 Platform
Please note that past performance does not guarantee future results.
● ANALYST OPINION: Wedbush forecasts $250. Citi forecasts $230. JPMorgan forecasts $225. Goldman Sachs forecasts $227. Morgan Stanley forecasts $220.
#APPLE, January 11, 2024
Current Price: 186.62
|
Apple |
Weekly |
|
Trend direction |
|
|
250.00 |
|
|
220.00 |
|
|
200.00 |
|
|
175.00 |
|
|
170.00 |
|
|
165.00 |
Example of calculation base on weekly trend direction for 1.00 Lot1
|
|
||||||
|
Profit or loss in $ |
6,338.00 |
3,338.00 |
1,338.00 |
-1,162.00 |
-1,662.00 |
-2,162.00 |
|
Profit or loss in €² |
5,775.92 |
3,041.97 |
1,219.34 |
-1,058.95 |
-1,514.61 |
-1,970.26 |
|
Profit or loss in £² |
4,966.09 |
2,615.46 |
1,048.38 |
-910.48 |
-1,302.25 |
-1,694.02 |
|
Profit or loss in C$² |
8,474.22 |
4,463.07 |
1,788.97 |
-1,553.65 |
-2,222.18 |
-2,890.70 |
1. 1.00 lot is equivalent of 100 units
2. Calculations for exchange rate used as of 10:20 (GMT) 11/01/2024
Fortrade recommends the use of Stop-Loss and Take-Profit, please speak to your Senior Account ManagerClient Manager regarding their use.
- You may wish to consider closing your position in profit, even if it is lower than suggested one
- Trailing stop technique can protect the profit – Ask your Senior Account ManagerClient Manager for more details