COCOA (#COCOA) Weekly Special Report based on 1 Lot Calculation:
TECHNICAL ANALYSIS:
- STRONG SUPPORT AREA BETWEEN $8000 AND $7000: As depicted by the daily chart below, cocoa prices tend to recover when they reach the levels in the area between $8000 and $7000.
- 14-DAY RELATIVE STRENGHT INDEX (RSI) POINTS TO A POTENTIAL RECOVERY: The index has recently approached the oversold territory, marked by 30, signaling a potential price recovery. Although, cocoa prices could also go in the opposite direction.
- ALL- TIME HIGH (DECEMBER 18, 2024): 12,911. Cocoa last traded around 7,914 and If the cocoa price tries to recover to its recent all-time high of 12,911, it can then offer an upside of around 60%, Although, prices can fall, too.
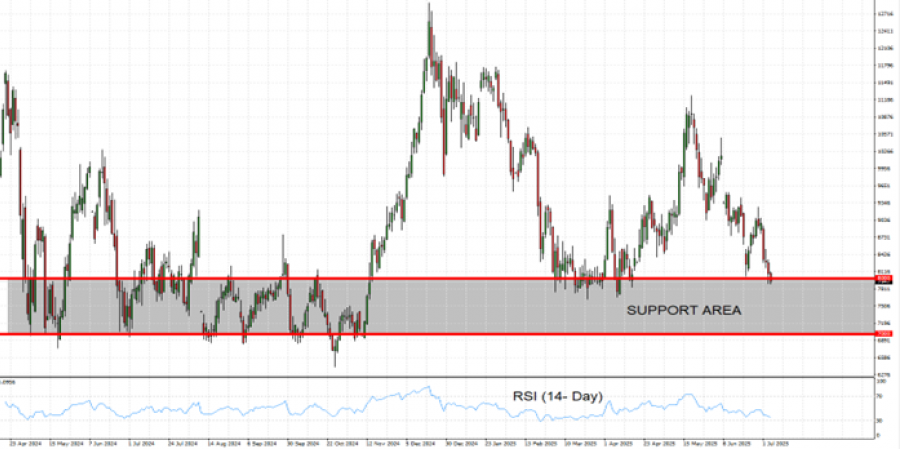
GRAPH (DAILY): APRIL 2024 - JULY 2025
Please note that past performance does not guarantee future results
SUPPLY SIDE:
- TOP PRODUCERS: The biggest producers are Ivory Coast (40% of world total), Ghana (20% of world total), Nigeria, and other small countries in Africa (10% of world total). All in all, West Africa produces around 70% of the world’s total. So, any problems that hit West Africa impact production on a massive scale.
- CHRONIC AGRICULTURAL PROBLEMS IN WEST AFRICA: Various problems, such as El Nino warm weather (compounded by climate change), Black pod fungal disease, and the swollen shoot virus could cause supply disruptions and price spikes of cocoa. This problem was made even worse by the fact that farmers in these producer countries are relatively poor and don’t have access to modern agricultural methods to protect their crops.
DEMAND SIDE:
- TOP CONSUMERS: The biggest consumers of cocoa are developed countries (around 70% of the total demand for cocoa), but the demand for cocoa may increase, especially from emerging and developing countries like China and India. (China and India have cocoa consumption growth rates of around 20% and 10% respectively, which means that the market could double on average every 3,6 and 7,2 years).
- HIGHER DEMAND GROWTH RATE: The average growth rate for world cocoa demand could be projected at 4.7%.
LOW FARM-GATE PRICES:
- FIXED PRICES DE-INCENTIVISE FARMERS TO GROW MORE CROPS: In Ghana and Cote d’Ivoire cocoa farmers receive a fixed price for their crops. Therefore, the famers have not benefited from the new and higher price movements of cocoa. This low price is making many farmers turn to more profitable or less regulated crops like rubber or even gold mining. Fewer cocoa farms translate into lower output and higher prices of cocoa. POTENTIAL SECENARIO: If West African governments decide to increase farm-gate prices it will also have a positive effect on the cocoa price, because a higher farm gate price will translate down the supply chain to higher prices of cocoa. Besides that, a higher farm-gate price will take a long time to incentivize new farmers to create new crops, and will be very slow to increase supply.
COCOA (#COCOA) July 07, 2025.
Current Price: 7,914
|
Cocoa |
Weekly |
|
Trend direction |
|
|
10,000 |
|
|
9,500 |
|
|
9,200 |
|
|
7,000 |
|
|
6,900 |
|
|
6,800 |
Example of calculation based on weekly trend direction for 1 Lot1
|
Cocoa |
||||||
|
|
||||||
|
Profit or loss in $ |
20,860 |
15,860 |
12,860 |
-9,140 |
-10,140 |
-11,140 |
|
Profit or loss in €² |
17,787 |
13,524 |
10,966 |
-7,794 |
-8,646 |
-9,499 |
|
Profit or loss in £² |
15,359 |
11,677 |
9,469 |
-6,730 |
-7,466 |
-8,202 |
|
Profit or loss in C$² |
28,538 |
21,697 |
17,593 |
-12,504 |
-13,872 |
-15,240 |
- 1.00 lot is equivalent of 10 units
- Calculations for exchange rate used as of 10:00 (GMT+1) 07/07/2025
There is a possibility to use of Stop-Loss and Take-Profit.
- You may wish to consider closing your position in profit, even if it is lower than suggested one
- Trailing stop technique could protect the profit.