GASOLINE weekly special report based on 1.00 Lot Calculation:
TECHNICAL ANALYSIS:
- LONG-TERM SUPPORT AREA BELOW THE PSYCHOLOGICAL MARK OF $2.000: Gasoline price has recently tested levels below $2.000, which has been acting as a support area since early 2021. However, there remains a risk of a potential breakout below this level if market conditions change.
- BREAKING (MAY 5): GASOLINE PRICES TESTED THE LEVEL OF $2.000. After testing the mark of $2.000, Gasoline prices managed to recover and hit $2.1938 on May 18 (Data Source: MetaTarder 4).
- BREAKING (SEPTEMBER 8, 2024): GASOLINE PRICES HIT THEIR LOWEST LEVEL SINCE FEBRUARY 2021 ($1,7064): Gasoline prices fell to their lowest in more than four years to hit the level of $1.7064 on September 8, 2024. After testing the mark of $1.7064, the Gasoline price managed to recover and hit $2.247 on March 30 (Data Source: MetaTarder 4).
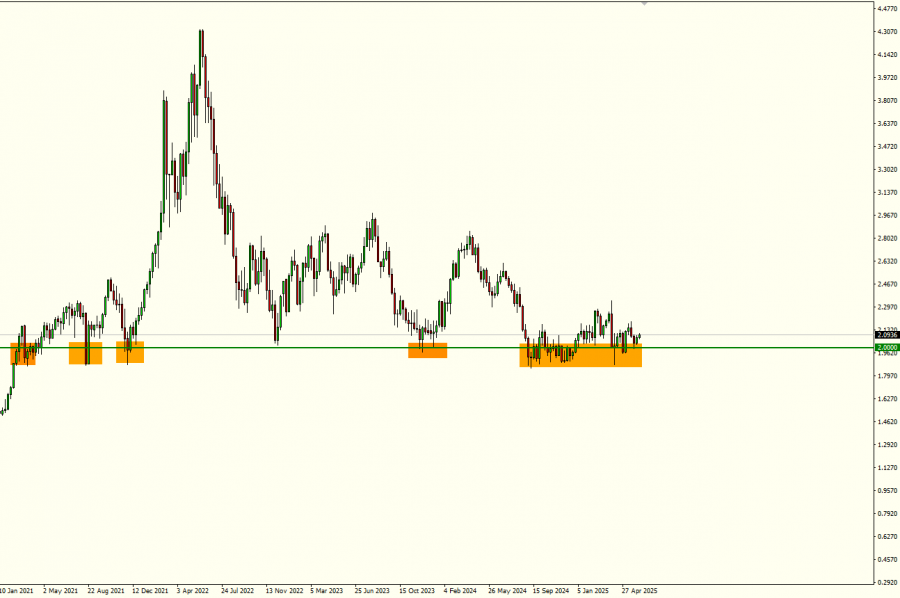
GRAPH (Weekly): February 2021 – June 2025
Please note that past performance does not guarantee future results
US DRIVING SEASON
- PERIOD: MEMORIAL DAY TO LABOUR DAY IN THE USA (MAY 26 TO SEPTEMBER 2). Usually, that time period of the year sees higher oil and petroleum consumption and demand, and more and more people in the US travel around. The period usually sees declining gasoline inventories in the US, due to higher consumption, signaling rising demand. This usually bodes well for gasoline prices, although prices could go in the opposite direction, as well.
EVENTS:
- TUESDAY, JUNE 10, AT 21:30 GMT+1: AMERICAN PETROLEUM INSTITUTE (API) WEEKLY OIL AND GASOLINE INVENTORY DATA. If inventory growth comes in lower than expected, it could signal tighter supply, supporting higher oil and gasoline prices.
- WEDNESDAY, JUNE 11 AT 15:30 GMT+1: ENERGY INFORMATION ADMINISTRATION (EIA) WEEKLY OIL AND GASOLINE INVENTORY DATA. If inventory growth comes in lower than expected, it could signal tighter supply, supporting higher oil and gasoline prices.
GEOPOLITICS:
- EVENT (EXPECTED: FRIDAY, JUNE 13 OR SUNDAY, JUNE 15): US - IRAN SIXTH ROUND OF NUCLEAR TALKS ARE EXPECTED TO CONTINUE EITHER ON FRIDAY (IN OSLO, NORWAY) OR SUNDAY (IN MUSCAT, OMAN) AFTER IRAN REJECTED THE U.S. DEAL PROPOSAL ON JUNE 9. Iran said on Monday (June 9) it will soon hand a counter-proposal for a nuclear deal to the United States in response to a U.S. offer that Tehran deems unacceptable, while U.S. President Donald Trump said talks would continue. Trump made clear that the two sides remained at odds over whether the country would be allowed to continue enriching uranium on Iranian soil. (Source: Reuters)
GASOLINE June 10, 2025
Current Price: 2.090
|
GASOLINE |
Weekly |
|
Trend direction |
|
|
2.340 |
|
|
2.240 |
|
|
2.160 |
|
|
2.020 |
|
|
2.000 |
|
|
1.970 |
Example of calculation base on weekly trend direction for 1.00 Lot1
|
GASOLINE |
||||||
|
Pivot Points |
||||||
|
Profit or loss in $ |
25,000 |
15,000 |
7,000 |
-7,000 |
-9,000 |
-12,000 |
|
Profit or loss in €2 |
21,942 |
13,165 |
6,144 |
-6,144 |
-7,899 |
-10,532 |
|
Profit or loss in £2 |
18,560 |
11,136 |
5,197 |
-5,197 |
-6,682 |
-8,909 |
|
Profit or loss in C$2 |
34,297 |
20,578 |
9,603 |
-9,603 |
-12,347 |
-16,463 |
- 1.00 lot is equivalent of 100,000 units
- Calculations for exchange rate used as of 11:00 (GMT+1) 10/06/2025
There is a possibility to use Stop-Loss and Take-Profit.
- You may wish to consider closing your position in profit, even if it is lower than suggested one.
- Trailing stop technique could protect the profit.