Natural Gas weekly special report based on 1.00 Lot Calculation:
NATURAL GAS USE AND MARKET SHARE:
- NATURAL GAS is mainly used for electricity generation and heating. In the U.S., about 45% of homes use natural gas for heating. Industries like chemicals, petroleum refining, metals production, food processing, and manufacturing (glass, bricks, paper) also consume large amounts. Natural gas is favored for its efficiency and lower emissions compared to other fossil fuels.
- MARKET SHARE - PRODUCERS: BIGGEST NATURAL GAS PRODUCERS IN THE WORLD. The U.S. is the largest producer, with ~25% of the global market share, while Russia is the second with ~15% of the market. Iran is third with ~5%.
- MARKET SHARE - LNG (LIQUEFIED NATURAL GAS) EXPORTERS: The U.S. is the major LNG exporter, holding ~ 21% of the global market share, while Australia is the second with ~ 20% of the market. Qatar is third with ~19% and Russia fourth with ~ 8% of the global market.
- MARKET SHARE - CONSUMERS: The U.S. is the world's largest natural gas consumer, with ~ 22% of global consumption, while Russia holds ~ 11.6%, the EU ~11% and China ~ 10.6%.
- MARKET SHARE - LNG- LIQUEFIED NATURAL GAS IMPORTERS: China is the world's largest LNG importer, with ~19-23.5% of global imports, Japan is second with ~ 16%- 18% and the EU ~14%-15%. (Source: IEA)
GEOPOLITICS: RUSSIA – UKRAINE CONFLICT
- EVENT (WEEK: DECEMBER 1 – DECEMBER 6): US SPECIAL ENVOY STEVE WITKOFF TO MEET PRESIDENT PUTIN IN RUSSIA. The special envoy of the US, Steve Witkoff, will visit Russia and likely meet with Russia’s president, Vladimir Putin. The Russian administration has announced that it will not make big concessions towards a peace agreement.
LAST TIME (OCTOBER): TRUMP - PUTIN CALL ON OCTOBER 16, 2025. The call led to a potential new summit between US President Trump and Russia’s Putin, but due to further disagreements, the summit never happened, and Trump announced sanctions on Russia’s Lukoil and Rosneft on October 22.
PRICE ACTION (OCTOBER 17 - OCTOBER 22): NATURAL GAS PRICE ROSE FROM $2.920 TO $3.565 (an increase of 22.08%). Before the collapse of the Putin–Trump summit and Trump’s sanctions on Russia’s Lukoil and Rosneft, the natural gas price had been declining to test $2.92 on some potential optimism. However, the summit efforts collapsed and, moreover, Trump announced oil sanctions on Russia (October 22), which caused natural gas prices to rise to $3.565 until October 22.
Data Source: MetaTrader 4 Platform
Please note that past performance does not guarantee future results
WEATHER FORECAST
- U.S. WINTER WEATHER FORECASTS FOR DECEMBER 2025 PREDICT COLDER-THAN-NORMAL TEMPERATURES especially for northern parts of the country, while the risk for cold snaps and sudden freezes is still a possibility for the southern parts of the country.
TECHNICAL ANALYSIS:
- SHORT-TERM UPTREND CHANNEL. Natural Gas is trading within a rising short-term trend channel, which started mid-October, and is marked by an upward-moving band with the price varying between the upper and lower levels. The band is marked by two dark blue moving lines.
- MOVING AVERAGES SUPPORTING UPTREND: The price of Natural Gas has been moving above the 20-, 50-, and 100-day moving averages, signaling an uptrend. If the price goes below the moving averages, the trend could reverse.
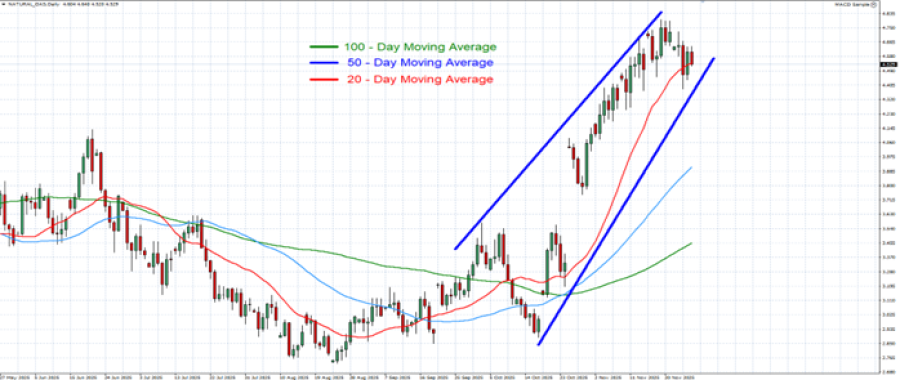
GRAPH (Daily): May 2025 – November 2025
Please note that past performance does not guarantee future results
Natural Gas, November 27, 2025.
Current Price: 4.520
|
NATURAL GAS |
Weekly |
|
Trend direction |
|
|
5.200 |
|
|
5.000 |
|
|
4.800 |
|
|
4.250 |
|
|
4.100 |
|
|
4.000 |
Example of calculation based on weekly trend direction for 1.00 Lot1
|
NATURAL GAS |
||||||
|
Pivot Points |
||||||
|
Profit or loss in $ |
6,800 |
4,800 |
2,800 |
-2,700 |
-4,200 |
-5,200 |
|
Profit or loss in €² |
5,871 |
4,144 |
2,418 |
-2,331 |
-3,626 |
-4,490 |
|
Profit or loss in £² |
5,148 |
3,634 |
2,120 |
-2,044 |
-3,180 |
-3,937 |
|
Profit or loss in C$² |
9,548 |
6,740 |
3,932 |
-3,791 |
-5,897 |
-7,302 |
- 1.00 lot is equivalent of 10,000 units
- Calculations for exchange rate used as of 13:10 (GMT) 27/11/2025
There is a possibility to use Stop-Loss and Take-Profit.
- You may wish to consider closing your position in profit, even if it is lower than the suggested one.
- Trailing stop techniques could protect the profit.