Special Report: USA100
Date: June 6, 2023
WEEKLY TREND: UP
US STOCK MARKETS
- STOCK MARKET TREND DEFINITION
BULL MARKET: DEFINITION. While bear markets signal a time of pessimism and economic decline, a bull market is defined by optimism and economic growth. A bull market is a period when stock prices are rising and investor sentiment is positive. During a bull market, stocks in a broad market index increase in value by 20% or more from recent bottom. According to First Trust, the average bull market period lasted 6.6 years with an average cumulative total return of 339%.
BEAR MARKET: DEFINITION. According to Forbes, economists define a bear market as a decline of 20% or more of a major stock market index, such as the NASDAQ 100, for a sustained period. SENTIMENT: During a bear market, market sentiment is poor. Investors are pessimistic about the stock market’s prospects, making them more likely to sell assets than hold them.
Table I: Bear and Bull Market Characteristics
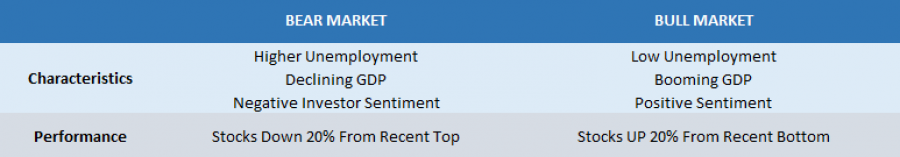
Data Source: Forbes
USA100 INDEX
- THE USA100 INDEX: TRANSITION FROM BEAR TO BULL MARKET
BEAR MARKET CONFIRMED in April, 2022. The Index fell 20% from 16765.87 (November 21, 2021) to 13412.70 (April 22, 2022). The market was there for 11- 12 months, having a maximum drop of 37.46% (October 13, 2022).
BEAR MARKET BOTTOM: October 13, 2022. The Index fell to 10484.68 by October 13, 2022, marking a total decline of 37.46% from its recent top of 16765.87 (November 11, 2021).
INDEX HAS RISEN MORE THAN 20% FROM RECENT BOTTOM TO ENTER A NEW BULL MARKET (5 Months): March 16, 2023. The index currently trades around 14,550, which is up by around 39% since the October 2022 bottom. If a full recovery followed to its recent all-time high, this could be an upside of additional 15%. However, it could also decline further.
- MOST RECENT RECOVERY FOLLOWING A BEAR MARKET (USA100):
2020 (COVID PANDEMIC DECLINE): After the pandemic decline of 32%, testing the rate of 6615.50 (March 22, 2020), the index had risen around 153% to its most recent all time high of 16765.87 (November 21, 2021).
2007- 2008 (GLOBAL FINANCIAL CRISIS): After a decline of around 55%, testing the rate of 1017.80 (November 16, 2008), the index trended up in a strong bull run to add around 860% until the Covid Pandemic Crisis (February 16, 2020 to reach the level of 9762).
However, please note that past performance does not guarantee future results.
- NEXT EVENTS
US INFLATION (JUNE 13 AT 13:30 GMT+1): INFLATION IS EXPECTED TO FALL IN MAY TO 4.1% FROM APRIL’S 4.9%. The US Inflation is now down from 9.1% in summer 2022, to April’s 4.90%, the lowest since May 2021.
US FEDERAL RESERVE INTEREST RATE DECISION (JUNE 14 AT 19:00 GMT+1): THE US FED IS EXPECTED TO MAKE A PAUSE AFTER 14 MONTHS OF RAT INCREASES AND KEEP INTEREST RATES UNCHANGED AT 5.25%. Falling inflation is contributing to this thesis as the Fed will not be willing to push the US economy into recession by hiking interest rates unbearably high.
USA100, June 6, 2023
Current Price:14,550
|
USA100 |
Weekly |
|
Trend direction |
|
|
16,766 |
|
|
16,000 |
|
|
15,250 |
|
|
13,900 |
|
|
13,700 |
|
|
13,500 |
Example of calculation based on weekly trend direction for 1 Lot1
|
USA100 |
||||||
|
Pivot Points |
||||||
|
Profit or loss in $ |
22,160 |
14,500 |
7,000 |
-6,500 |
-8,500 |
-10,500 |
|
Profit or loss in €2 |
20,710 |
13,551 |
6,542 |
-6,075 |
-7,944 |
-9,813 |
|
Profit or loss in £2 |
17,839 |
11,673 |
5,635 |
-5,233 |
-6,843 |
-8,453 |
|
Profit or loss in C$2 |
29,725 |
19,450 |
9,390 |
-8,719 |
-11,402 |
-14,084 |
1. 1.00 lot is equivalent of 10 units
2. Calculations for exchange rate used as of 09:00 (GMT+1) 06/06/2023
Fortrade recommends the use of Stop-Loss and Take-Profit, please speak to your Senior Account ManagerClient Manager regarding their use.
- You may wish to consider closing your position in profit, even if it is lower than suggested one
- Trailing stop technique can protect the profit – Ask your Senior Account ManagerClient Manager for more detail