USA100 Weekly Special Report based on 1.00 Lot Calculation:
- WHAT IS A STOCK INDEX: According to Investopedia.com, a stock index measures the price performance of a basket (group) of stocks using a standardized methodology. The NASDAQ 100 Index is one of the world's best-known indexes and one of the most commonly used benchmarks for the stock market.
- COMPONENTS: USA100 includes 100 companies such as Amazon, Google, Nvidia, Meta, and Microsoft.
ANALYSIS:
- THE NASDAQ BULL RUN CONTINUES, WITH THE MARKET NOW UP MORE THAN 80% FROM ITS OCTOBER 2022 LOWS: The Nasdaq has sharply rallied from October 2022 lows, as the tech sector continues to remain the best performing sector in the United States. The Nasdaq rally has outpaced both the S&P500 and the Dow Jones Industrial index since October 2022.
STATISTICS:
- LAST SEVEN QUARTERLY EARNINGS SEASONS: THE ARTIFICIAL INTELLIGENCE (A.I.) EUPHORIA HAS CREATED ON AVERAGE A 4.95% INCREASE FOR THE USA100 DURING THE EARNINGS SEASONS. The table below illustrates price reactions of the three major US stock indices. On average, the USA100 index has risen by 4.95% each quarterly earnings season since Q3 2022. Over the same period, the USA500 index rose 3.68%, while the USA30 index climbed around 3.34%. NEXT (Q2) EARNINGS SEASON: JULY 15 – AUGUST 15, 2024.
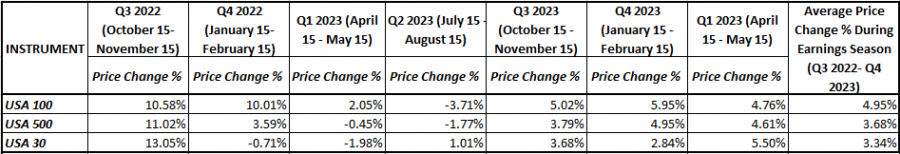
Data Source: MetaTrader 4 Platform
Please note that past performance does not guarantee future results
- USA100: JULY PERFORMANCE (2015 – 2023): THE USA100 ROSE ON AVEARGE 4.66% EACH JULY SINCE 2015
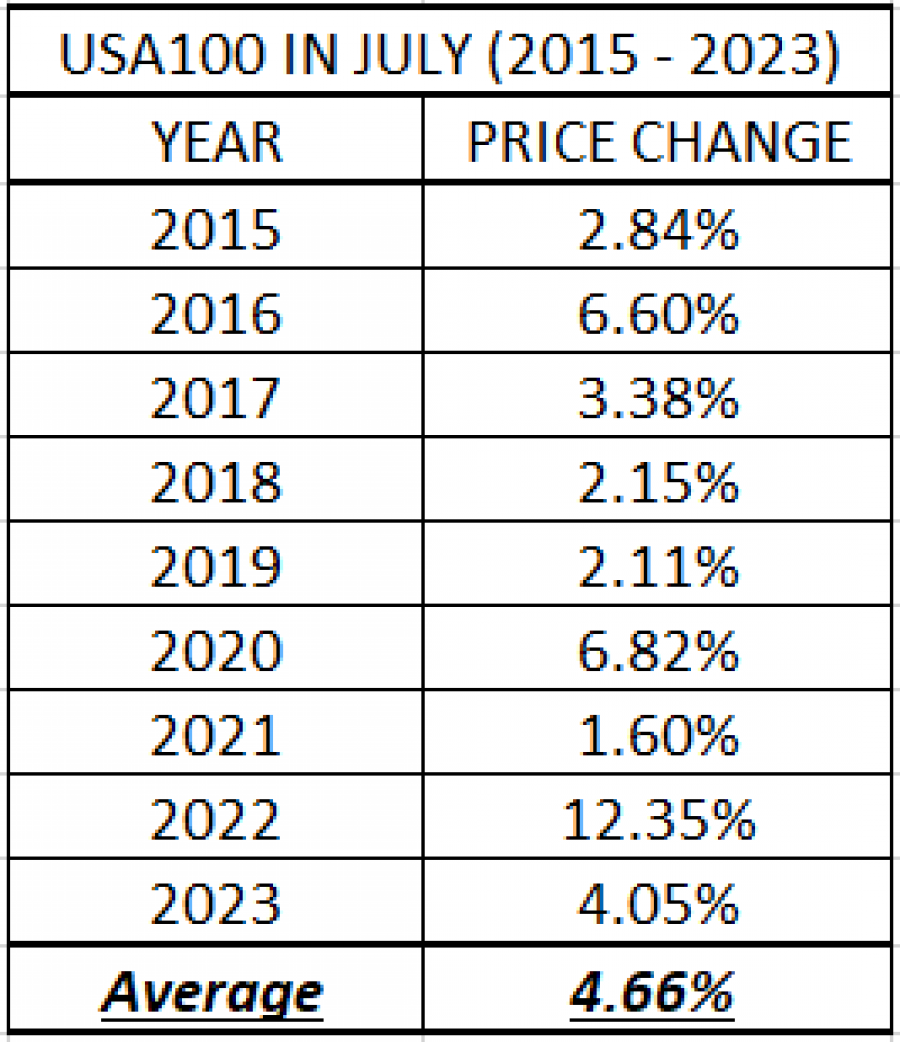
Data Source: Bloomberg
Please note that past performance does not guarantee future results
USA100, JUNE 24, 2024
Current Price: 19,990
|
USA100 |
Weekly |
|
Trend direction |
|
|
22,000 |
|
|
21,500 |
|
|
20,800 |
|
|
19,200 |
|
|
19,100 |
|
|
19,000 |
Example of calculation base on weekly trend direction for 1.00 Lot1
|
USA100 |
||||||
|
Profit or loss in $ |
20,100 |
15,100 |
8,100 |
-7,900 |
-8,900 |
-9,900 |
|
Profit or loss in €² |
18,746 |
14,083 |
7,554 |
-7,368 |
-8,301 |
-9,233 |
|
Profit or loss in £² |
15,878 |
11,928 |
6,398 |
-6,240 |
-7,030 |
-7,820 |
|
Profit or loss in C² |
27,477 |
20,642 |
11,073 |
-10,799 |
-12,166 |
-13,533 |
1. 1.00 lot is equivalent of 10 units
2. Calculations for exchange rate used as of 10:20 (GMT+1) 24/06/2024
Fortrade recommends the use of Stop-Loss and Take-Profit, please speak to your Senior Account ManagerClient Manager regarding their use.
- You may wish to consider closing your position in profit, even if it is lower than suggested one
- Trailing stop technique can protect the profit – Ask your Senior Account ManagerClient Manager for more detail