GOLD weekly special report based on 1.00 Lot Calculation:
GEOPOLITICS: U.S.A/ISRAEL – IRAN WAR
- BREAKING (FEBRUARY 28): U.S./ISRAEL – IRAN WAR BEGAN. The war between the U.S. and Israel on one side and Iran on the other side began on Saturday, February 2, with U.S. and Israeli strikes on Iran, reportedly killing the Supreme Leader, Ayatollah Ali Khamenei.
- IRAN RETALIATED. Iranian forces retaliated by firing missiles and targeting U.S. bases in the region. The Iranian missiles reportedly hit several countries in the region, such as the U.A.E., Bahrain, Qatar, Kuwait, Saudi Arabia, Jordan, Iraq, and Israel.
- GOLD: PRICE ACTION. The safe-haven gold did see increased demand initially, as investors sought refuge in gold, as they usually do in times of market distress. Gold prices rose initially by around $140, hitting levels not seen in one month, and above $5,400 per ounce.
EVENTS
- FRIDAY, MARCH 6 AT 13:30 GMT: US NON-FARM PAYROLLS AND UNEMPLOYMENT RATE (FEBRUARY). One of the most important indicators in the US labor market, if it shows a deteriorating situation (high unemployment rates and low numbers of newly employed), it could prove supportive for Gold, because it will motivate the FED to cut interest rates in the near future. The number of newly employed was 130,000 last month.
PRICE ACTION
- GOLD PRICE HIT A NEW ALL-TIME HIGH ON JANUARY 28, 2026 ($5,597.41). Gold currently trades around $5,398, and if it fully recovers to its previous all-time high, it could see an upside of around $200. However, the price could also decline.
- ANALYSTS’ OPINION: Wells Fargo forecasts $6,100; Bank of America forecasts $6,000; Goldman Sachs forecasts $5,400; Morgan Stanley forecasts $5,700; UBS forecasts $6,200; JPMorgan forecasts $6,300; Deutsche Bank forecasts $6,000; Societe General forecasts $6,000.
TECHNICAL ANALYSIS
- LONG-TERM TREND IS UP. The overall trend of gold is up (black trendline), with the trend accelerating since mid – August of 2025.
- SUPPORT AREA: $5,100 – $5,000. Gold prices have found a support zone in the range between $5,100 and $5,000. However, it could also decline.
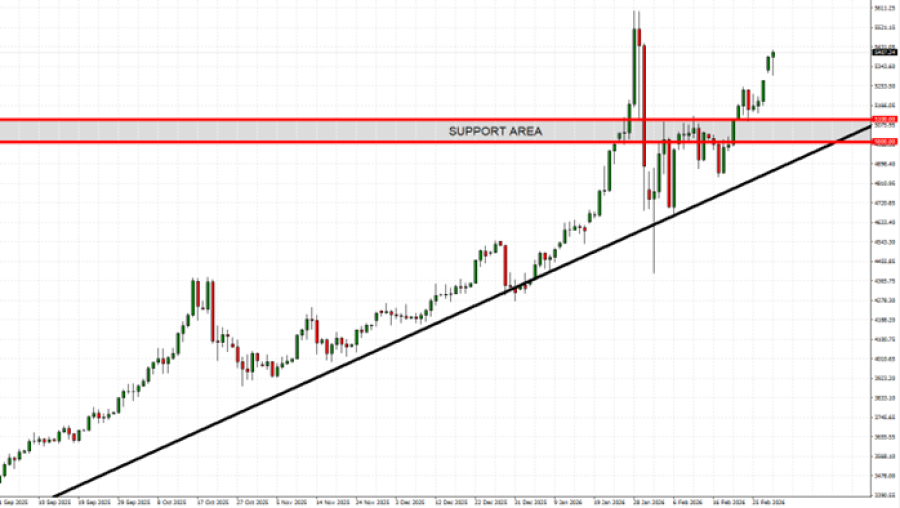
GRAPH (Daily): September 2025 – February 2026
Please note that past performance does not guarantee future results
GOLD, March 2, 2026
Current Price: 5,398
|
GOLD |
Weekly |
|
Trend direction |
|
|
6,000 |
|
|
5,800 |
|
|
5,600 |
|
|
5,200 |
|
|
5,150 |
|
|
5,100 |
Example of calculation base on weekly trend direction for 1.00 Lot1
|
GOLD |
||||||
|
Pivot Points |
||||||
|
Profit or loss in $ |
60,200 |
40,200 |
20,200 |
-19,800 |
-24,800 |
-29,800 |
|
Profit or loss in €2 |
51,405 |
34,327 |
17,249 |
-16,907 |
-21,177 |
-25,446 |
|
Profit or loss in £2 |
45,077 |
30,101 |
15,125 |
-14,826 |
-18,570 |
-22,314 |
|
Profit or loss in C$2 |
82,248 |
54,923 |
27,598 |
-27,052 |
-33,883 |
-40,714 |
- 1.00 lot is equivalent of 100 units
- Calculations for exchange rate used as of 08:00 (GMT) 02/03/2026
There is a possibility to use Stop-Loss and Take-Profit.
- You may wish to consider closing your position in profit, even if it is lower than suggested one.
- Trailing stop technique could protect the profit.