Fortrade Canada Ltd. as an order-execution only dealer is not permitted to provide you with any advice or recommendations. These Market Commentaries should not be construed as a recommendation, advice or any attempt by Fortrade Canada Ltd. to prompt or influence you in making an investment decision to purchase, sell, hold or exchange any security or to influence the timing of such activity. This content is produced by Fortrade Limited which is not registered in any capacity with any securities regulatory authority in Canada.
69% of retail investor accounts lose money when trading CFDs with this provider.
CFDs are complex instruments and come with a high risk of losing money rapidly due to leverage. 69% of retail investor accounts lose money when trading CFDs with this provider. You should consider whether you understand how CFDs work and whether you can afford to take the high risk of losing your money.
70.88% of retail investor accounts lose money when trading CFDs with this provider.
CFDs are complex instruments and come with a high risk of losing money rapidly due to leverage. 70.88% of retail investor accounts lose money when trading CFDs with this provider. You should consider whether you understand how CFDs work and whether you can afford to take the high risk of losing all your money. Read full risk warning.
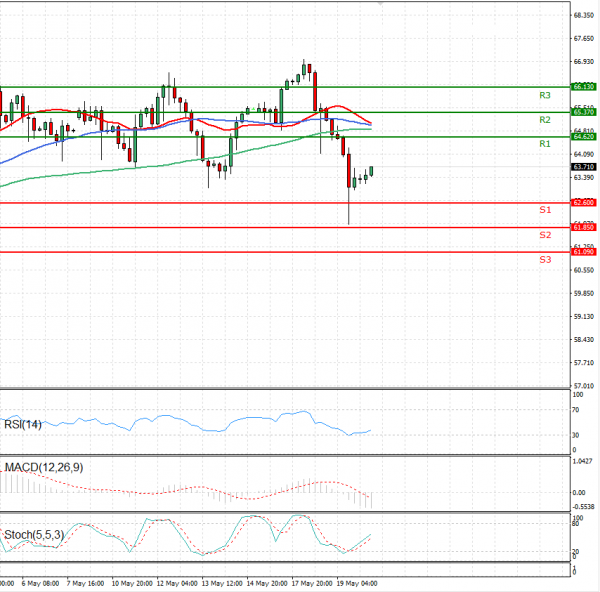
EU Session Analysis for CFD Instruments 20/05/2021
Fundamental analysis
20 May, 2021
Oil prices fell on Thursday after a slump in the previous session, as rising U.S. stockpiles added to concerns about a hit to demand from surging coronavirus infections in Asia and possible U.S. rate hikes. Almost two-thirds of people tested in Indian show exposure to the coronavirus, suggesting a spiralling spread of the virus as the daily death toll rose to a record 4,529. The decline in prices this week was given added impetus on Wednesday after media reports said the U.S. and Iran have made progress in talks over Tehran's nuclear programme that could result in sanctions being lifted and more supply coming to the market. Later reports indicated that more time was needed to reach an agreement. Speculation the Fed might raise rates weighed on the outlook for economic growth and prompted investors to reduce exposure to oil and other commodities Rising U.S. stockpiles of crude also weighed on prices, although the gain in the most recent week was below expectations. Crude inventories increased by 1.3 million barrels last week, against analysts' expectations in a Reuters poll for a 1.6 million-barrel rise.