Fortrade Canada Ltd. as an order-execution only dealer is not permitted to provide you with any advice or recommendations. These Market Commentaries should not be construed as a recommendation, advice or any attempt by Fortrade Canada Ltd. to prompt or influence you in making an investment decision to purchase, sell, hold or exchange any security or to influence the timing of such activity. This content is produced by Fortrade Limited which is not registered in any capacity with any securities regulatory authority in Canada.
69% of retail investor accounts lose money when trading CFDs with this provider.
CFDs are complex instruments and come with a high risk of losing money rapidly due to leverage. 69% of retail investor accounts lose money when trading CFDs with this provider. You should consider whether you understand how CFDs work and whether you can afford to take the high risk of losing your money.
70.88% of retail investor accounts lose money when trading CFDs with this provider.
CFDs are complex instruments and come with a high risk of losing money rapidly due to leverage. 70.88% of retail investor accounts lose money when trading CFDs with this provider. You should consider whether you understand how CFDs work and whether you can afford to take the high risk of losing all your money. Read full risk warning.
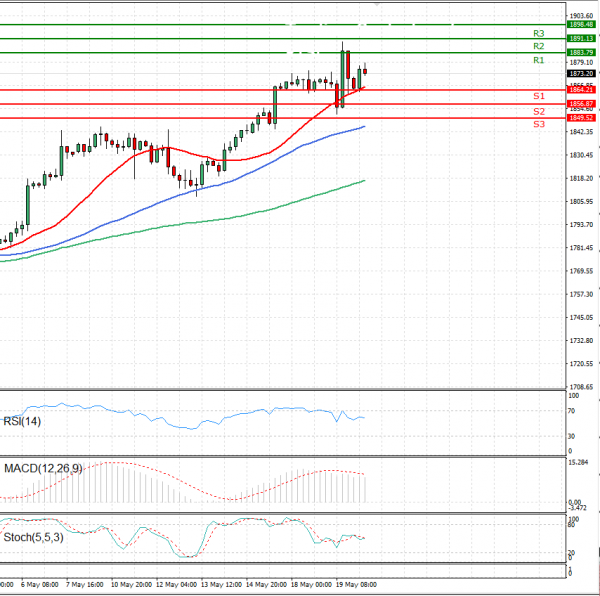
EU Session Analysis for CFD Instruments 20/05/2021
Fundamental analysis
20 May, 2021
Gold prices climbed on Thursday, aided by growing U.S. inflationary pressure, although gains were curbed as the dollar rebounded and U.S. Treasury yields rose after Federal Reserve policymakers hinted at a possible shift in future policy. Gold prices rose more than 1% on Wednesday to their highest since Jan. 8, but pared most of the gains as the dollar index bounced off from a near three-month low and benchmark U.S. Treasury yields rose to a near one-week high after the Fed minutes. Minutes of the U.S. central bank's April 27-28 meeting said a number of policymakers thought if the U.S. economy continued rapid progress, it would be appropriate "at some point" to discuss tightening its accommodative policy.