Fortrade Canada Ltd. as an order-execution only dealer is not permitted to provide you with any advice or recommendations. These Market Commentaries should not be construed as a recommendation, advice or any attempt by Fortrade Canada Ltd. to prompt or influence you in making an investment decision to purchase, sell, hold or exchange any security or to influence the timing of such activity. This content is produced by Fortrade Limited which is not registered in any capacity with any securities regulatory authority in Canada.
69% of retail investor accounts lose money when trading CFDs with this provider.
CFDs are complex instruments and come with a high risk of losing money rapidly due to leverage. 69% of retail investor accounts lose money when trading CFDs with this provider. You should consider whether you understand how CFDs work and whether you can afford to take the high risk of losing your money.
70.88% of retail investor accounts lose money when trading CFDs with this provider.
CFDs are complex instruments and come with a high risk of losing money rapidly due to leverage. 70.88% of retail investor accounts lose money when trading CFDs with this provider. You should consider whether you understand how CFDs work and whether you can afford to take the high risk of losing all your money. Read full risk warning.
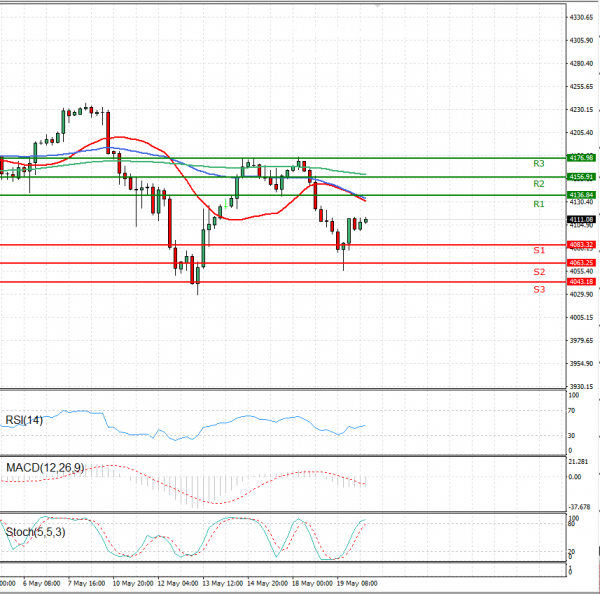
EU Session Analysis for CFD Instruments 20/05/2021
Fundamental analysis
20 May, 2021
Wall Street’s main indexes closed lower on Wednesday after minutes from an April Federal Reserve meeting showed participants agreed the U.S. economy remained far from the central bank’s goals, with some eyeing a future discussion of tapering its bond buying program. Strong inflation readings and signs of a worker shortage in recent weeks have fueled fears and roiled stock markets despite reassurances from Fed officials that the rise in prices would be temporary. All three main indexes hit their session lows in morning trade, after opening sharply lower at the open, then partially recovered before the release of the Fed minutes pressured them anew.