Netflix (#NFLX)
October 14, 2026
Risk Disclaimer: The example below is for illustrative purposes only and is based on price movements derived from Contracts for Difference (CFDs). The calculations reflect hypothetical outcomes using historical or specified price data for the relevant instrument on the stated date and are not indicative of future performance. Any reliance placed on this material is strictly at the user’s own risk.
Weekly Special Report: Netflix (#NFLX)
THE COMPANY
- NETFLIX is one of the world's leading streaming services, available in over 190 countries, with more than 325 million paid subscribers as of the end of 2025. The company has expanded its advertising business, increased content licensing, introduced higher subscription prices, and continued efforts to limit password sharing.
- STOCK INDEX PARTICIPATION: Netflix stock is part of the NASDAQ 100 (USA100) and S&P 500 (USA500) indices.
NETFLIX: MARKET SHARE (USA AND WORLDWIDE)
- MARKET SHARE (USA): Netflix leads the U.S. subscription video-on-demand (SVOD) market with approximately 20% market share, followed by Amazon Prime Video at 17%, Hulu at 13%, HBO Max at 12%, Disney+ at 11%, Apple TV+ at 8%, Paramount+ at 7%, and Peacock at 5%.
- MARKET SHARE (WORLDWIDE): Netflix leads the global subscription streaming market with approximately 27.7% market share, followed by Amazon Prime Video at approximately 23.9%, Disney+ at 13.7%, Max at 13.3%, Paramount+ at 8.1%, Hulu at 5.6%, and Peacock at 4.2%, based on estimated global paid subscriptions in 2025.
Source: Advance Television, TelecomLead, JustWatch
NETFLIX: EVENTS
- EVENT (TUESDAY, OCTOBER 20, AFTERMARKET): Q3 EARNINGS REPORT. Netflix will release its third-quarter financial results. Netflix is expected to print $ 12.88 billion in revenue (new record), up 12% from the same period last year ($11.51 billion). Net income is expected to reach $3.46 billion, up 36% from $2.55 billion a year earlier.
- LAST REPORT (JULY 16, 2026): Q2 EARNINGS REPORT. The company reported $12.56 billion in revenue, up 13% from the same period last year ($11.08 billion). Net income reached $3.40 billion, up 9% from $3.13 billion a year earlier. Net income beat expectations in 7 of the last 8 reports, while revenue beat expectations in 6 of 8.
Source: Bloomberg Terminal
NETFLIX: ADVERTISING REVENUE SET FOR SHARP GROWTH
- NETFLIX EXPECTS ADVERTISING REVENUE TO REACH APPROXIMATELY $3 BILLION IN 2026, NEARLY DOUBLE THE 2025 LEVEL. The company reported that advertising commitments in the U.S. for 2026 had nearly doubled compared with the previous year.
- ADVERTISING CAMPAIGNS IN JAPAN INCREASED 12 TIMES during January–September compared with the same period in 2025.
TECHNICAL ANALYSIS AND PRICE ACTION
- SUPPORT AREA: $70 - $65. Netflix's share price is trading around $70, just around the support area between $65 and $70. The stock has tested this area at least two times since June 2026 and recovered, confirming its technical importance. A break below $65, however, could lead to further declines.
- NETFLIX STOCK HIT AN ALL-TIME HIGH OF $134.12 (JUNE 30, 2025). The stock is currently trading around $70, and a full recovery to its previous all-time high would represent potential upside of around 92%. However, further declines remain possible.
- FORECAST (Source: Bloomberg Terminal): UBS forecasts $115; Morgan Stanley forecasts $80; JPMorgan forecasts $85; HSBC forecasts $76; Deutsche Bank forecasts $95; Citigroup forecasts $100.
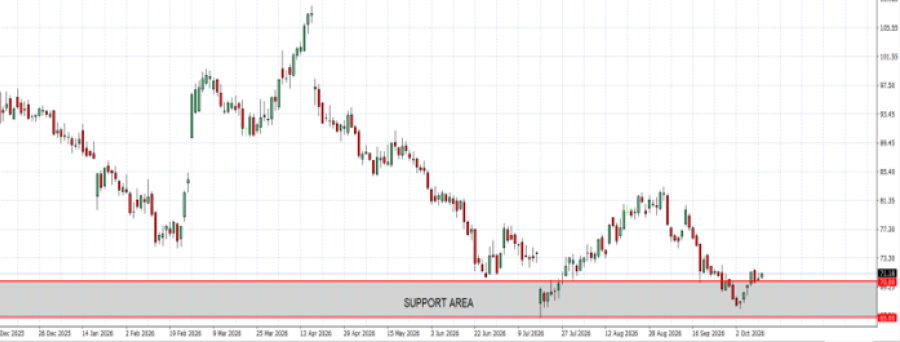
GRAPH (Daily): December 2025 – October 2026
Please note that past performance does not guarantee future results
#NFLX, October 14, 2026
Current Price: 70
|
Netflix |
Weekly |
|
Market Trend |
|
|
90 |
|
|
83 |
|
|
77 |
|
|
64 |
|
|
62 |
|
|
60 |
Example of calculation based on weekly market trend for 1.00 Lot1
|
NETFLIX |
||||||
|
Pivot Points |
||||||
|
Profit or loss in $ |
200,000 |
130,000 |
70,000 |
-60,000 |
-80,000 |
-100,000 |
|
Profit or loss in €² |
178,779 |
116,206 |
62,573 |
-53,634 |
-71,512 |
-89,389 |
|
Profit or loss in £² |
150,833 |
98,041 |
52,792 |
-45,250 |
-60,333 |
-75,416 |
|
Profit or loss in C$² |
284,236 |
184,753 |
99,483 |
-85,271 |
-113,694 |
-142,118 |
- The above calculations are made based on 1.00 lot which is equivalent of 10,000 units
- Calculations for exchange rate used as of 09:05 (GMT+1) 14/10/2026
You can use risk management tools such as Stop-Loss and Take-Profit


