USA500
November 19, 2026
Risk Disclaimer: The example below is for illustrative purposes only and is based on price movements derived from Contracts for Difference (CFDs). The calculations reflect hypothetical outcomes using historical or specified price data for the relevant instrument on the stated date and are not indicative of future performance. Any reliance placed on this material is strictly at the user’s own risk.
Weekly Special Report: USA500
USA500:
- USA500 represents the S&P 500, which includes 500 of the largest publicly traded companies in the United States across all major sectors. It features industry leaders such as Tesla, Apple, Google, Nvidia, Meta, Amazon, Microsoft, and Goldman Sachs.
EVENT: Q3 2026 EARNINGS SEASON
US Q3 EARNINGS SEASON: The AI-fueled boom keeps rolling, 84% of USA500 companies that have reported beat estimates, and earnings are growing 31.4%. NVIDIA confirmed that the AI boom is accelerating with revenue more than doubled to a record $115.8 billion, and Data Center sales jumped 110%, potentially driving the USA500 upwards again.
COMPANY EARNINGS CALENDAR: Q3 2026 EARNINGS SEASON (Confirmed)
- Dell: 24/11/2026, Aftermarket
- Best Buy: 24/11/2026, Premarket
- HP Inc.: 24/11/2026, Aftermarket
- Deere: 25/11/2026, Premarket
- Micron: 16/12/2026, Aftermarket (expected, not yet confirmed)
EVENTS:
- WEDNESDAY, NOVEMBER 25 AT 14:30 GMT+1: U.S. Q3 GDP. The first estimate showed the U.S. economy growing at a strong 3.4% annualized pace in Q3, the fastest in a year. Confirmation of solid growth could support the USA500.
- WEDNESDAY, NOVEMBER 25 AT 14:30 GMT+1: U.S. CORE PCE PRICE INDEX. This is the Federal Reserve’s preferred inflation gauge, and it rose 3.1% in September. A softer October reading could ease rate-hike fears ahead of the Fed’s December 9 decision and offer significant potential upside for the USA500.
- WEDNESDAY, DECEMBER 9 AT 20:00 GMT+1: FEDERAL RESERVE INTEREST RATE DECISION. The Fed’s final decision of 2026. Rates are currently 3.75%–4.00% after the Fed held steady in October. Another hold would reassure markets that tightening is on pause, offering significant potential upside for the USA500 heading into year-end.
OTHER EVENTS: APEC SUMMIT 2026
- APEC SUMMIT: PRESIDENTS TRUMP, XI AND PUTIN MEET IN HISTORIC FIRST. A historic breakthrough for global markets! For the first time ever, Presidents Trump, Xi and Putin met face to face. With the world’s three biggest powers moving towards cooperation, geopolitical risk is easing and investor confidence is surging. That’s a powerful catalyst that could fuel the bull market and propel the USA500 to fresh record highs.
- A $57 TRILLION OPPORTUNITY FOR USA500 COMPANIES. APEC’s 21 economies make up nearly 60% of global GDP and roughly half of world trade. Improving relations expand the addressable market for S&P 500 companies across all sectors, supporting upside to earnings estimates and multiple expansion. We see this as a key catalyst for the next leg of the bull market, with the USA500 well positioned for new all-time highs.
TECHNICAL ANALYSIS:
- SUPPORT AREA: 7,300-7,200. After reaching a record high of 7,897, the USA500 has remained above the 7,300–7,200 support area. This range could continue to provide support during potential market pullbacks, although the price could head in the other direction too.
- UPTREND: The USA500 has continued to trend higher in 2026, rising to a maximum of 11% fueled by the AI boom and positive earnings. Although prices could also decline.
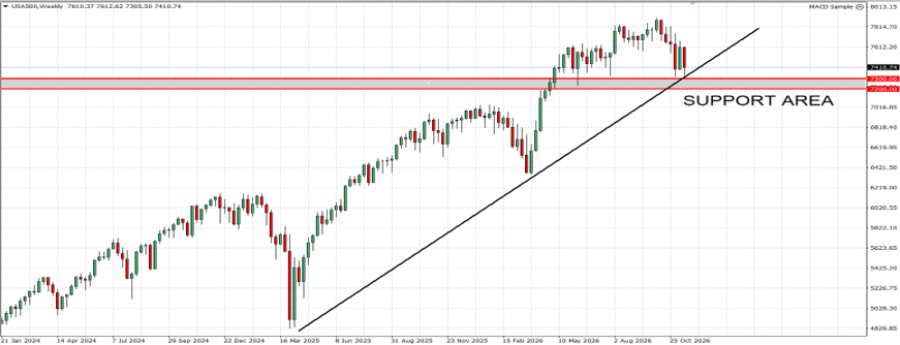
GRAPH (Weekly): January 2024 – November 2026
Please note that past performance does not guarantee future results
USA500, November 19, 2026
Current Price: 7,410
|
USA500 |
Weekly |
|
Market Trend |
|
|
7,750 |
|
|
7,650 |
|
|
7,550 |
|
|
7,300 |
|
|
7,250 |
|
|
7,200 |
Example of calculation based on weekly market trend for 1.00 Lot1
|
USA500 |
||||||
|
Pivot Points |
||||||
|
Profit or loss in $ |
3,400 |
2,400 |
1,400 |
-1,100 |
-1,600 |
-2,100 |
|
Profit or loss in €2 |
3,092 |
2,183 |
1,273 |
-1,000 |
-1,455 |
-1,910 |
|
Profit or loss in £2 |
2,586 |
1,825 |
1,065 |
-837 |
-1,217 |
-1,597 |
|
Profit or loss in C$2 |
4,861 |
3,432 |
2,002 |
-1,573 |
-2,288 |
-3,003 |
- The above calculations are made based on 1.00 lot which is equivalent of 10 units
- Calculations for exchange rate used as of 14:50 (GMT+1) 11/19/2026
You can use risk management tools such as Stop-Loss and Take-Profit


