NVIDIA (#NVDA)
July 15, 2026
Risk Disclaimer: The example below is for illustrative purposes only and is based on price movements derived from Contracts for Difference (CFDs). The calculations reflect hypothetical outcomes using historical or specified price data for the relevant instrument on the stated date and are not indicative of future performance. Any reliance placed on this material is strictly at the user’s own risk.
Weekly Special Report: NVIDIA (#NVDA)
THE COMPANY:
- NVIDIA'S BUSINESS: NVIDIA develops graphics processing units (GPUs), AI Chips, AI accelerators, networking solutions, and software platforms. Its chips power artificial intelligence, data centers, gaming, professional visualization, robotics, and autonomous vehicle technologies.
- NVIDIA'S LATEST AI CHIP ROADMAP: NVIDIA follows an annual AI chip release cycle. The roadmap includes Blackwell (2024), Blackwell Ultra (2025), Rubin (expected in 2026), Rubin Ultra (expected in 2027), and Feynman, which is expected to succeed the Rubin architecture in 2028.
- NVIDIA IS THE MOST VALUABLE COMPANY IN THE WORLD: NVIDIA is currently the world's most valuable publicly traded company, with a market capitalization exceeding $5 trillion.
- STOCK INDEX PARTICIPATION (USA100, USA500, USA30): NVIDIA is a constituent of the NASDAQ 100 (USA100), S&P 500 (USA500), and Dow Jones Industrial Average (USA30).
NVIDIA: MARKET SHARE
- NVIDIA HOLDS AROUND 80% OF THE AI CHIP INDUSTRY. Mizuho Securities estimates that Nvidia controls between 70% and 95% of the market for AI chips, while Nasdaq.com reported that Nvidia holds 80% market share. Other rivals such as AMD, Intel, Broadcom, Alphabet, or Amazon seem to be still far behind Nvidia.
NVIDIA: EVENTS
- EVENT (CONFIRMED: WEDNESDAY, AUGUST 26, AFTERMARKET): Q2 EARNINGS REPORT. According to Bloomberg, NVIDIA is expected to print $91.63 billion in revenue (new record high), up about 96% from $46.74 billion in the same period last year. NVIDIA is expected to report net income of $50.92 billion (new record high, an increase of roughly 114% from $23.77 billion last year).
- LAST TIME (MAY 20, AFTERMARKET): Q1 EARNINGS REPORT. Nvidia reported record-high quarterly revenue of $81.62 billion, beating analysts’ estimates of $78.86 billion. The company also posted a record quarterly net income of $45.50 billion.
Source: Bloomberg Terminal
NVIDIA: MAJOR INVESTMENTS TO DATE
- LATEST STRATEGIC PARTNERSHIP (June 2026): NVIDIA signed a multi-year partnership with SK Hynix, its largest memory supplier, to develop faster memory chips for future AI products. The deal will support NVIDIA's next generation of AI chips, supercomputers, AI PCs, and robotics. NVIDIA also said it already buys billions of dollars' worth of memory from SK hynix each year, with purchases expected to increase.
- INVESTMENTS: NVIDIA has strategically invested across the AI ecosystem, including OpenAI ($30 billion), Anthropic ($10 billion), Mistral AI ($1.85 billion), xAI ($6 billion), Scale AI ($1 billion), Figure AI, Cohere ($150–300 million), Perplexity AI ($73.6 million), Runway (approximately $864 million), Intel ($5 billion), Nebius Group ($2 billion), and CoreWeave ($2 billion).
Source: CNBC, Yahoo Finance, Reuters, xAI News, Perplexity Official Blog, Runway’s Newsroom, Nvidia.com
NVIDIA: TECHNICAL ANALYSIS AND PRICE ACTION
- SUPPORT AREA: $200 - $190. After reaching a fresh all-time high in May ($236.03), NVIDIA’s stock price has recently pulled back and found support in the $200 - $190 range. However, further declines remain possible.
- UPTREND (2026): The stock has risen by around 13% over the past year, hitting an all-time high of $236.03 in late mid-May 2026.
- FORECAST (Bloomberg Terminal): HSBC forecasts $325; Goldman Sachs forecasts $285; Barclays forecasts $275; Citi forecasts $300; JP Morgan forecasts $280; Well Fargo forecasts $315;
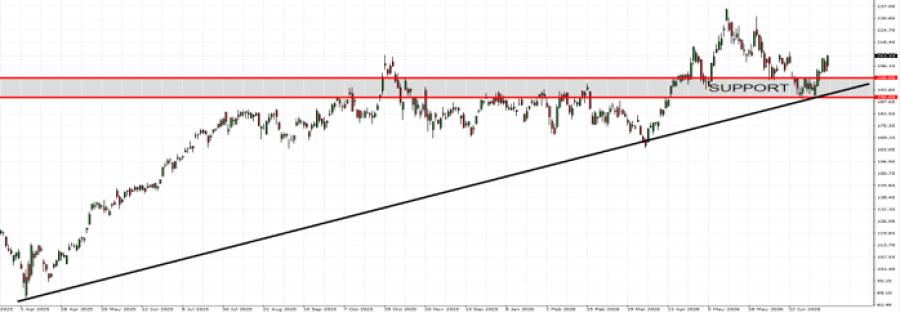
GRAPH (Daily): April 2025 – July 2026
Please note that past performance does not guarantee future results
#NVDA, July 15, 2026
Current Price: 211
|
NVIDIA |
Weekly |
|
Market Trend |
|
|
270 |
|
|
250 |
|
|
230 |
|
|
193 |
|
|
190 |
|
|
185 |
Example of calculation based on weekly market trend for 1.00 Lot1
|
NVIDIA |
||||||
|
Pivot Points |
||||||
|
Profit or loss in $ |
59,000 |
39,000 |
19,000 |
-18,000 |
-21,000 |
-26,000 |
|
Profit or loss in €2 |
51,651 |
34,142 |
16,633 |
-15,758 |
-18,384 |
-22,761 |
|
Profit or loss in £2 |
44,052 |
29,119 |
14,186 |
-13,440 |
-15,679 |
-19,413 |
|
Profit or loss in C$2 |
82,922 |
54,813 |
26,704 |
-25,298 |
-29,515 |
-36,542 |
- The above calculations are made based on 1.00 lot which is equivalent of 1000 units
- Calculations for exchange rate used as of 11:00 (GMT+1) 15/07/2026
You can use risk management tools such as Stop-Loss and Take-Profit.


