GOLD weekly special report based on 1.00 Lot Calculation:
GEOPOLITICS: POTENTIAL TRADE CONFLICTS FLARE UP AGAIN
- BREAKING (JULY 8): U.S. TO IMPOSE 50% TARIFFS ON COPPER IMPORTS. Trade tensions increase insecurity, which in turn increases the demand for Gold as a safe-haven instrument. US President Donald Trump said that he will impose 50% tariffs on copper imports, which are expected to take effect within the next 30 days.
GEOPOLITICS: US TAX CUT BILL
- BREAKING (JULY 4): U.S. PRESIDENT DONALD TRUMP SIGNED THE NEW TAX BILL INTO LAW. The new “Big Beautiful Bill” has been signed into law, cutting taxes and increasing in the mid to long term US debt and budget deficits.
- ANALYSTS’ OPINION: The bill is expected to provide tax cuts of 4.5 trillion dollars, and provide the US the possibility to increase their debt by another, near, 4 trillion dollars. The measure could be expected to put negative pressure on the US dollar, which in turn provides support to the gold prices.
EVENTS:
- THURSDAY, JULY 10, AT 13:30 GMT+1: US INITIAL JOBLESS CLAIMS: A higher than expected number should prove positive for Gold, because it could point to future interest rate cuts by the FED. This data measures the number of individuals who filed for unemployement insurance for the first time during the past week. Last week’s data stood at 233,000 which was lower than the week before (237,000).
- TUESDAY, JULY 15, AT 13:30 GMT+1: US INFLATION (CPI) (JUNE). A lower than expected reading should be taken as positive for Gold, as it will increase the odds of a future interest rate cut by the FED. This data measures the change in the price of goods and services from the perspective of the consumer. The data for the previous month was 2.4% which was higher than the month before (2.3%).
TECHNICAL ANALYSIS:
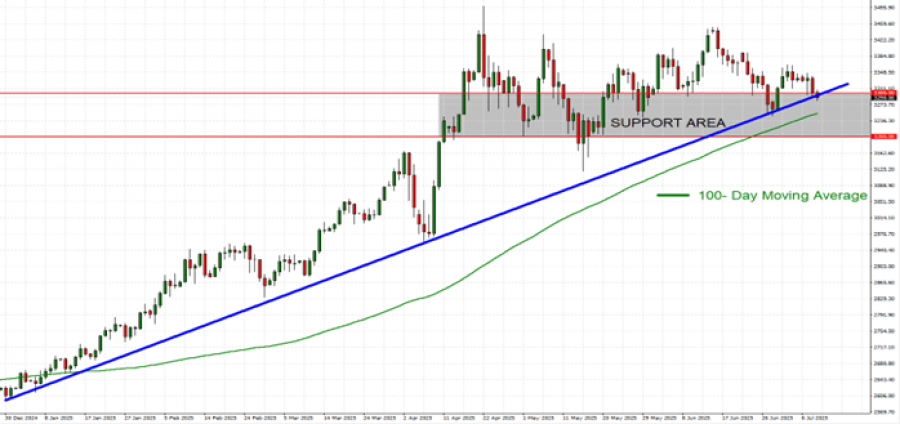
- SUPPORT AREA BETWEEN $3,300 AND $3,200: Gold prices have seen near-term support at $3,300, and an extended support level at $3,200, meaning the area between $3,300 and $3,200 altogether acts as a near-term support area.
- LONG–TERM UPTREND: As depicted by the daily chart below, the gold price has kept trading above the long-term dark blue uptrend line, confirming its long-term trend is up. However, there remains a risk of a potential breakout below this level if market conditions change.
- 100- DAY MOVING AVERAGE POINTS TO AN UPTREND: The 100-Day Moving Average continued to point to an uptrend as the gold price has remained steady above it.
- GOLD HIT A NEW ALL-TIME HIGH OF $3,499.76 (April 22, 2025): Gold has traded around $3,285, and if a full recovery takes place, the price of Gold could rise around $215. Although the price could decline as well.
GRAPH (Daily): January 2025 – July 2025
Please note that past performance does not guarantee future results
GOLD, JULY 9, 2025.
Current Price: 3,285
|
GOLD |
Weekly |
|
Trend direction |
|
|
3,500 |
|
|
3,400 |
|
|
3,350 |
|
|
3,230 |
|
|
3,215 |
|
|
3,200 |
Example of calculation base on weekly trend direction for 1.00 Lot1
|
GOLD |
||||||
|
Pivot Points |
||||||
|
Profit or loss in $ |
21,500 |
11,500 |
6,500 |
-5,500 |
-7,000 |
-8,500 |
|
Profit or loss in €2 |
18,371 |
9,826 |
5,554 |
-4,699 |
-5,981 |
-7,263 |
|
Profit or loss in £2 |
15,827 |
8,466 |
4,785 |
-4,049 |
-5,153 |
-6,257 |
|
Profit or loss in C$2 |
29,448 |
15,751 |
8,903 |
-7,533 |
-9,588 |
-11,642 |
- 1.00 lot is equivalent of 100 units
- Calculations for exchange rate used as of 12:10 (GMT+1) 09/07/2025
There is a possibility to use Stop-Loss and Take-Profit.
- You may wish to consider closing your position in profit, even if it is lower than suggested one.
- Trailing stop technique could protect the profit.