Natural Gas weekly special report based On 1 Lot Calculation:
FUNDAMENTAL FACTORS:
-
Europe (and Asia) gas refilling is under way: Both Europe and Asia have commenced refilling their gas storages ahead of the winter season this year, with demand for natural gas expected to continue rising. Average gas flows to all seven big U.S. LNG export plants have risen to 14.0 billion cubic feet per day (bcfd) so far in April, up from a record 13.2 bcfd in March, signaling the export gains could continue in the weeks to come.
-
HIGHER DEMAND EXPECTED DUE TO HOT SUMMER TEMPERATURES. Natural gas is widely used as an energy source to power air conditioners throughout the summer season when temperatures get warmer. According to the National Oceanic and Atmospheric Administration, El Nino warming conditions have been confirmed, with record breaking temperatures expected. The weather could be expected to cause a spike in cooling (air-condition) demand.
-
US GAS DRILLERS CUT OIL AND GAS RIGS, WITH RIG COUNT DOWN 12% YEAR-ON-YEAR: With oil and gas rigs set to continue being cut, natural gas production is set to decline. This in turn could support natural gas prices.
STATISTICS (JULY- OCTOBER AVERAGE PRICE MOVEMENTS FOR THE PERIOD BETWEEN 2016 AND 2022):
-
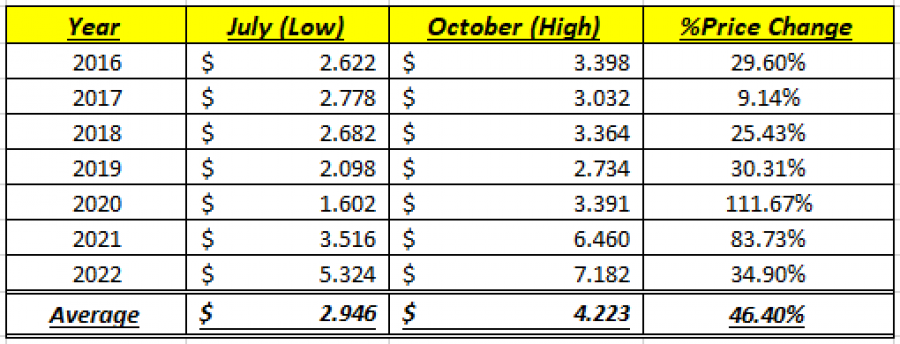
SEASONAL EFFECTS HISTORICALLY IMPACT NATURAL GAS PRICES WITH AN AVERAGE INCREASE OF 46.40% FROM JULY LOWS TO OCTOBER HIGHS (2016-2022): As shown by the table below, Natural Gas usually goes up between July and October. The move fundamentally could be explained by rising natural gas demand during hot months (air conditioning) like July and August and fears over natural gas shortages ahead of the winter season that starts in October.
-
July 2023 Low was $2.482.
Source: MT4
*Please note that past performance does not guarantee future results.
PRICE ACTION:
-
NATURAL GAS HIT ITS LOWEST PRICE IN 2 YEARS AND 7 MONTHS ($1.943): Natural Gas has undergone a downward correction of around 80.50% since August 21, 2022. Natural gas traded last around $2.65 and if a full recovery followed, that could imply an upside of around 492%. However, the price could decline further.
-
TECHNICAL REVIEW: The price has fallen to its traditional bottom of around 2.00. The bottom near $2 has been tested only six times since September 1996.

Graph: Natural Gas Price (1996-2023)
Source: MT4
NATURAL GAS, July 26, 2023
Current Price: 2.65
|
NATURAL GAS |
Weekly |
|
Trend direction |
|
|
3.80 |
|
|
3.50 |
|
|
2.90 |
|
|
2.40 |
|
|
2.25 |
|
|
2.05 |
Example of calculation based on weekly trend direction for 1 Lot1
|
Pivot Points |
||||||
|
Profit or loss in $ |
11,500.00 |
8,500.00 |
2,500.00 |
-2,500.00 |
-4,000.00 |
-6,000.00 |
|
Profit or loss in €² |
10,388.81 |
7,678.69 |
2,258.44 |
-2,258.44 |
-3,613.50 |
-5,420.25 |
|
Profit or loss in £² |
8,905.24 |
6,582.13 |
1,935.92 |
-1,935.92 |
-3,097.47 |
-4,646.21 |
|
Profit or loss in C$² |
15,212.14 |
11,243.76 |
3,306.99 |
-3,306.99 |
-5,291.18 |
-7,936.77 |
1. 1 lot is equivalent of 10,000 units
2. Calculations for exchange rate used as of 14:30 (GMT+1) 26/07/2023
Fortrade recommends the use of Stop-Loss and Take-Profit, please speak to your Senior Account ManagerClient Manager regarding their use.
· You may wish to consider closing your position in profit, even if it is lower than suggested one
· Trailing stop technique can protect the profit – Ask your Senior Account ManagerClient Manager for more details