Copper Weekly Special Report based on 1 Lot Calculation:
TECHNICAL ANALYSIS:
- 14-DAY RELATIVE STRENGTH INDEX (RSI) POINTS TO WEAKENED COPPER PRICE MOMENTUM: According to the daily chart below, the 14-Day RSI is trading below the 30 level, reflecting weaker recent price performance. Therefore, a price recovery could be expected next, although prices could go in the other direction as well.
- STRONG SUPPORT AT $4: Copper prices have tested the mark of $4 in total 4 times since August 2024. This technical indicator indicates that the current downside potential remains limited, although if prices break below $4, then a negative trend could be observed.
- COPPER PRICE HIT AN ALL-TIME HIGH OF $5.9552 (July 24, 2025): The copper price currently trades around $4.33, and if a full recovery occurs, then copper prices could see an upside of around 37%. Although price could decline, too.
- COPPER PRICE HAS TESTED ITS LOWEST PRICE IN 3 AND A HALF MONTHS ($4.3302): After the most recent pullback of copper prices, losing more than 20% over the past two days, copper prices have tested their lowest levels in 3 and a half months ($4.3302).
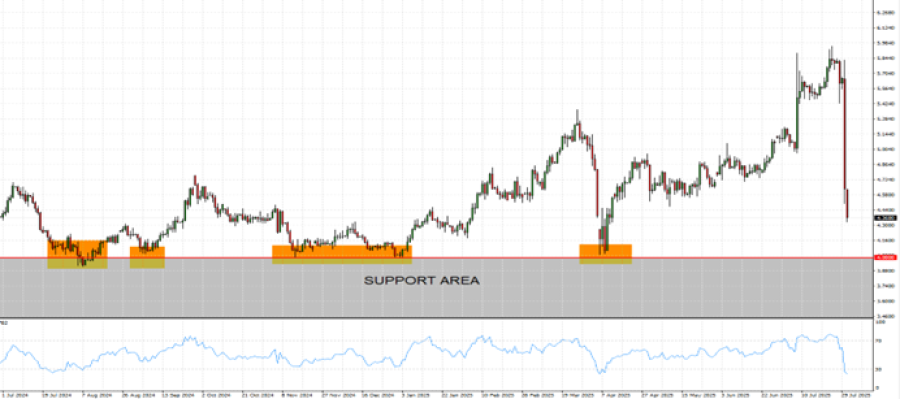
GRAPH (Daily): July 2024 - July 2025
Please note that past performance does not guarantee future results
GEOPOLITICS: TRADE PROGRESS
- US TARIFF DEADLINE EXTENDED TO AUGUST 1 FROM THE PREVIOUS JULY 9. The US is still expected to announce more deals after clinching deals with the UK, Vietnam, Indonesia, Japan, South Korea, and the E.U. Next on the list could be India, Canada, and Mexico, where announcements are expected to be made by August 1 or beyond.
- BREAKING (JULY 30): U.S. AND SOUTH KOREA ANNOUNCED A TRADE AGREEMENT.
- BREAKING (JULY 27): U.S. AND E.U. ANNOUNCED A TRADE AGREEMENT.
- BREAKING (JULY 23): US PRESIDENT DONALD TRUMP ANNOUNCED A TRADE DEAL WITH JAPAN.
GEOPOLITICS: TENSIONS RISE BETWEEN THE USA AND RUSSIA
- EVENT (EXPECTED BY AUGUST 10, 2025): US PRESIDENT TRUMP WILL SLAP NEW SANCTIONS AND SECONDARY TARIFFS ON RUSSIA COMMODITY EXPORTS IF NO CEASEFIRE DEAL IS REACHED WITHIN THE NEXT 10 DAYS (EXPECTED BY AUGUST 10, 2025). According to Reuters, U.S. President Donald Trump set a new deadline of 10 (down from the previous 50-day deadline set on July 14) for Russia to make progress toward ending the war in Ukraine or face consequences. Trump has threatened sanctions on both Russia and buyers of its oil unless progress is made. Trump reiterated that, without a deal, his administration would impose 100% secondary tariffs on countries continuing to import Russian commodities, including copper.
- RUSSIA IS THE 4TH LARGEST REFINED COPPER EXPORTER IN THE WORLD. Russia is the 4th largest refined copper exporter in the world after Chile, Japan, and Australia. Russia’s refined copper gets exported to China, Turkey, Italy, Egypt, and Germany.
GEOPOLITICS: US TARIFFS
- BREAKING (JULY 31): US PRESIDENT TRUMP ANNOUNCED 50% TARIFFS ON COPPER IMPORTS TO TAKE EFFECT AUGUST 1. US President Trump confirmed that a 50% tariff on some copper imports will be implemented, with enforcement beginning August 1.
- IMPORTANCE: U.S.A. RELIES ON IMPORTS FOR 45% OF ITS COPPER CONSUMPTION. The U.S. relies on imports for 45% of its copper consumption, and a 50% tariff could disrupt supply chains.
EVENTS (USA):
- FRIDAY, AUGUST 1 AT 13:30 GMT+1: US NONFARM PAYROLLS (NFP) AND UNEMPLOYMENT RATE (JULY). US labor data remains in focus as the Fed weighs its next move. June NFP beat forecasts (147,000 vs. 111,000) and unemployment fell to 4.1% (vs. 4.3% expected).
- SATURDAY, AUGUST 9 AT 02:30 GMT+1: CHINA INFLATION (CPI) (JULY). A higher-than-expected reading could support copper prices by indicating improving economic activity, especially in the construction and manufacturing sectors. (PREVIOUS: +0.1%)
COPPER, July 31, 2025.
Current Price: 4.33
|
COPPER |
Weekly |
|
Trend direction |
|
|
6.00 |
|
|
5.50 |
|
|
5.00 |
|
|
4.00 |
|
|
3.90 |
|
|
3.80 |
Example of calculation based on weekly trend direction for 1.00 Lot1
|
COPPER |
||||||
|
Pivot Points |
||||||
|
Profit or loss in $ |
16,700 |
11,700 |
6,700 |
-3,300 |
-4,300 |
-5,300 |
|
Profit or loss in €² |
14,617 |
10,241 |
5,864 |
-2,888 |
-3,764 |
-4,639 |
|
Profit or loss in £² |
12,640 |
8,856 |
5,071 |
-2,498 |
-3,255 |
-4,012 |
|
Profit or loss in C$² |
23,131 |
16,206 |
9,280 |
-4,571 |
-5,956 |
-7,341 |
- 1.00 lot is equivalent of 10 000 units
- Calculations for exchange rate used as of 11:30 (GMT+1) 31/07/2025
There is a possibility to use Stop-Loss and Take-Profit
- You may wish to consider closing your position in profit, even if it is lower than the suggested one.
- Trailing stop technique could protect the profit