GOLD weekly special report based on 1.00 Lot Calculation:
TECHNICAL ANALYSIS:
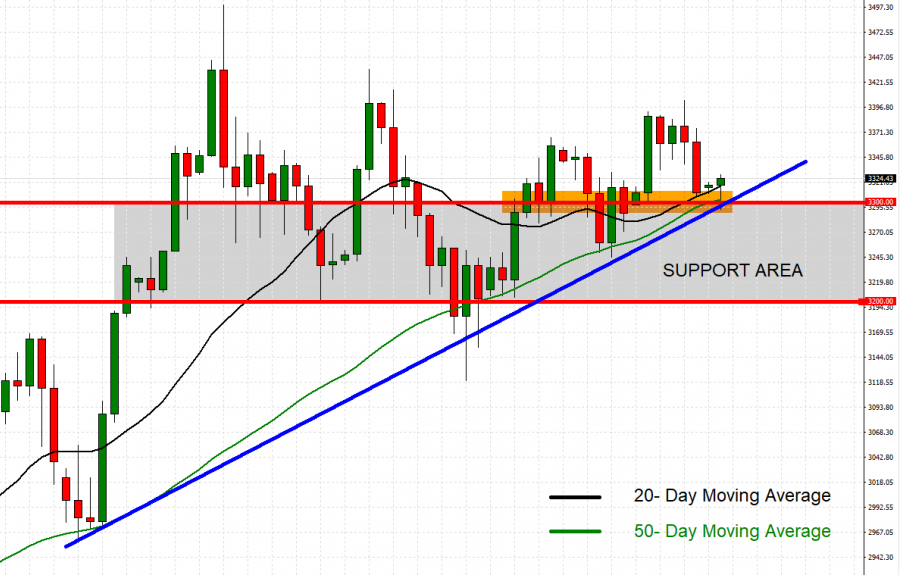
- SUPPORT AREA BETWEEN $3,300 AND $3,200: Gold prices have seen near-term support at $3,300, and an extended support level at $3,200, meaning the area between $3,300 and $3,200 altogether acts as a near-term support area.
- DAILY MOVING AVERAGES POINT TO AN UPTREND: Gold prices have managed to stay above the 20- and 50-day moving Averages, pointing to an ongoing uptrend. However, gold prices can also change their trend if prices fall below the 20- and 50-day moving averages.
- MID–TERM UPTREND: As depicted by the daily chart below, the gold price has kept trading above the mid-term blue-lined uptrend channel, confirming its mid-term trend is up. However, there remains a risk of a potential breakout below this level if market conditions change.
- GOLD HIT A NEW ALL-TIME HIGH OF $3,499.76 (April 22, 2025). Gold has traded around $3,320, and if a full recovery takes place, the price of Gold could rise around $180. Although the price could decline as well.
GRAPH (Daily): April 2025 – June 2025
Please note that past performance does not guarantee future results
EVENTS:
- WEDNESDAY, JUNE 11, AT 13:30 GMT+1: US INFLATION (CPI) (MAY). U.S. inflation has continued to fall in 2025, hitting 2.3% in April, which is the lowest rate since early 2021. If data continues to show firm declines in May, investors will increase their expectations for a Fed interest rate cut sooner rather than later. This, in turn, could put negative pressure on the US Dollar, while gold prices could see some positive pressure.
GEOPOLITICS:
- US – IRAN NUCLEAR TALKS IN JEOPARDY: US PRESIDENT TRUMP ULTIMATUM TO IRAN EXPIRES THIS WEEK; U.S. STILL WAITING FOR IRAN’S RESPONSE TO THE U.S. PROPOSAL. Trump's two-month deadline for a deal will expire this week, according to the White House's interpretation of that timeline. In March, President Trump's letter to Iran's Supreme Leader Ali Khamenei included a two-month deadline for reaching a new nuclear deal, which began ticking out when negotiations began in April. The two countries have held five rounds of Omani-mediated talks since April, with no breakthrough progress announced yet. Meanwhile, Iranian officials said the response to the U.S.'s last proposal, which was already condemned by Iran’s Supreme Leader Ali Khamenei, is now being drafted.
ANALYSTS’ OPINION:
- CITIGROUP has a price target of $3,500
- J.P. MORGAN has a price target of $3,675.
- GOLDMAN SACHS has a price target of $3,700.
- UBS has a price target of $3,500.
Source: Reuters, Bloomberg, CNBC
GOLD, June 9, 2025
Current Price: 3,320
|
GOLD |
Weekly |
|
Trend direction |
|
|
3,500 |
|
|
3,450 |
|
|
3,400 |
|
|
3,250 |
|
|
3,240 |
|
|
3,220 |
Example of calculation base on weekly trend direction for 1.00 Lot1
|
GOLD |
||||||
|
Pivot Points |
||||||
|
Profit or loss in $ |
18,000 |
13,000 |
8,000 |
-7,000 |
-8,000 |
-10,000 |
|
Profit or loss in €2 |
15,759 |
11,381 |
7,004 |
-6,128 |
-7,004 |
-8,755 |
|
Profit or loss in £2 |
13,267 |
9,582 |
5,897 |
-5,160 |
-5,897 |
-7,371 |
|
Profit or loss in C$2 |
24,622 |
17,782 |
10,943 |
-9,575 |
-10,943 |
-13,679 |
- 1.00 lot is equivalent of 100 units
- Calculations for exchange rate used as of 09:00 (GMT+1) 09/06/2025
There is a possibility to use Stop-Loss and Take-Profit.
- You may wish to consider closing your position in profit, even if it is lower than suggested one.
- Trailing stop technique could protect the profit.