Natural Gas weekly special report based on 1.00 Lot Calculation:
TECHNICAL ANALYSIS
- STRONG SUPPORT AT THE LEVEL OF $3 OR NEAR: Since December 2024, Natural Gas prices have tested 4 times the level of $3 or near, and currently the price of Natural Gas is near that level.
- RECOVERY AND PRICE ACTION AFTER TESTING LEVELS NEAR $3 (December 2024 – May 2025): Natural gas prices may return to the mark of $3.5 after testing $3 since December 2024. In early March 2025, Natural Gas tested the level of $4.93, which was its highest rate since December 2022.
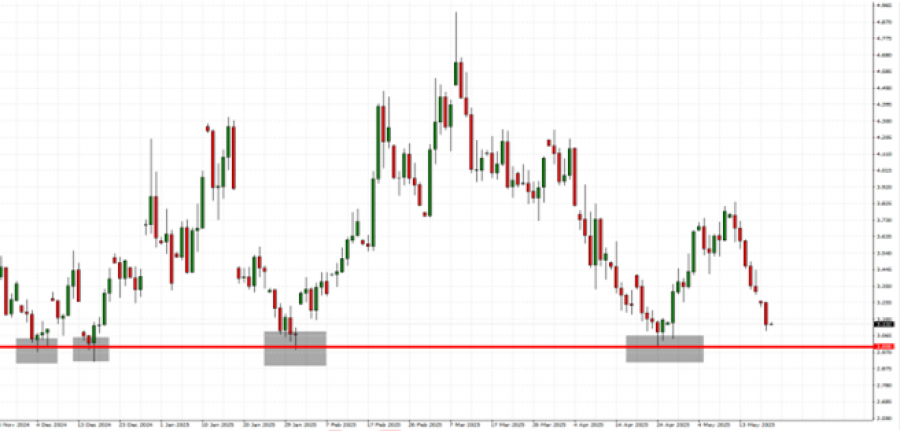
GRAPH (Daily): December 2024 – May 2025
Please note that past performance does not guarantee future results
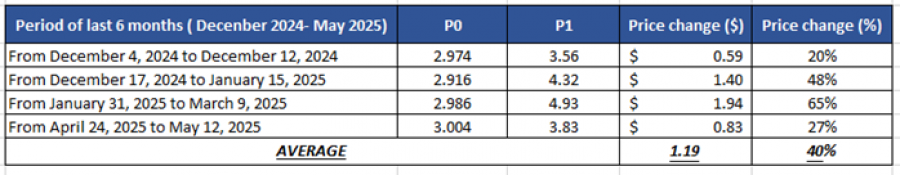
- STATISTICS: NOVEMBER 2024-MAY 2025. NATURAL GAS PRICE RECOVERED BY AROUND 40% AFTER TESTING THE MARK OF $3 OR NEAR IT. However, there is also a risk of further decline if market conditions change.
Data Source: Meta Trader 4 Platform
Please note that past performance does not guarantee future results
EUROPE EXPECTED TO SOON START BUYING BIG QUANTITIES OF NATURAL GAS
- EUROPEAN NATURAL GAS STORAGE REFILLING SEASON STARTS MARCH- APRIL AND ENDS IN NOVEMBER.
- MANDATE: EUROPEAN NATURAL GAS STORAGE MUST BE FULL AT LEAST 90% BY NOVEMBER
- CURRENT: AT AROUND 44.5%;
- EUROPE BUYS BIG QUANTITIES OF LIQUIFIED NATURAL GAS (LNG) FROM THE USA: US supplies 45% of Europe's total LNG imports.
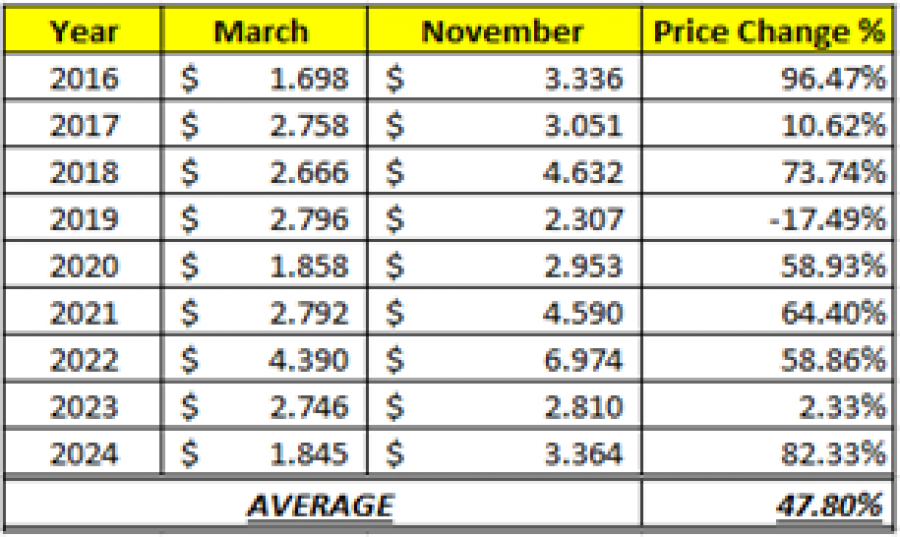
- STATISTICS (2016 - 2024): NATURAL GAS PRICES ROSE 47.80% ON AVERAGE DURING THE EUROPEAN REFILLING SEASON (MARCH – NOVEMBER)
Data Source: Meta Trader 4 Platform
Please note that past performance does not guarantee future results
NATURAL GAS: PRICE ACTION
NATURAL GAS PRICES HIT $9.972 IN AUGUST, 2022. Natural gas prices have risen due to Europe’s crisis and reduced Russian supply, boosting U.S. LNG demand. A rebound to $9.972 would represent a rise of approximately 216% from the current price of $3.16, though further declines cannot be ruled out.
Natural Gas, May 20, 2025
Current Price: 3.16
|
NATURAL GAS |
Weekly |
|
Trend direction |
|
|
4.50 |
|
|
4.00 |
|
|
3.60 |
|
|
2.80 |
|
|
2.70 |
|
|
2.60 |
Example of calculation based on weekly trend direction for 1.00 Lot1
|
NATURAL GAS |
||||||
|
Pivot Points |
||||||
|
Profit or loss in $ |
13,400 |
8,400 |
4,400 |
-3,600 |
-4,600 |
-5,600 |
|
Profit or loss in €² |
11,906 |
7,463 |
3,909 |
-3,199 |
-4,087 |
-4,976 |
|
Profit or loss in £² |
10,021 |
6,282 |
3,290 |
-2,692 |
-3,440 |
-4,188 |
|
Profit or loss in C$² |
18,676 |
11,707 |
6,132 |
-5,017 |
-6,411 |
-7,805 |
- 1.00 lot is equivalent of 10,000 units
- Calculations for exchange rate used as of 11:00 (GMT+1) 20/05/2025
There is a possibility to use Stop-Loss and Take-Profit.
- You may wish to consider closing your position in profit, even if it is lower than the suggested one.
- Trailing stop techniques could protect the profit.