NETFLIX(#NFLX) weekly special report based On 1.00 Lot Calculation:
NETFLIX: THE COMPANY
- NETFLIX is one of the world's leading streaming services with over 260 million paid subscribers in over 190 countries. In the last 2 years, the company made several impactful changes and moves like an increase in third-party licensing, new ad plan membership and success in cracking down password sharing issues.
- AVATAR LAST AIRBENDER TV SHOW released in late February became its most successful original drama with 22.2 million global viewers in four days while SCI FI SHOW BODY PROBLEM released on March 21st had 11 million views over its first four days of availability.
NETFLIX: UPCOMING EVENTS
- EARNINGS FOR Q1, April 18, 2024 (after-market). Expectations are very positive, with earnings per share projected to grow by 28.8% and revenues expected to increase by 13.5% compared to the previous year.
- STRONG Q4 RESULTS: The company ended off the year with 13% revenue and 13.2 million added subscribers in Q4, up 12.8% year over year, bringing the total number of subscribers to 260 million. The rollout of paid sharing supported strong subscriber and revenue growth in 2023. Analysts at JPMorgan estimate NFLX monetized ~22 million borrowers at the end of 2023, including 13 million of the 30 million total net adds last year.
Stock Price Performance around Earnings Releases in 2023
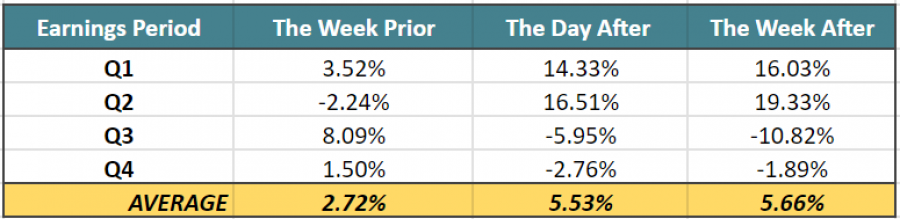
Source: MT4
Please note that past performance does not guarantee future results
ANALYST OPINION: UBS increased its target to $685. Wedbush is targeting $615. Redburn Atlantic is targeting $740. JPMorgan raised its price target to $650 from $610
STOCK PRICE ACTION: Netflix stock made its all-time high of $700.99 in November 2021. Since the beginning of the year, the stock price is already 26.45% up and currently trades around $611 which is around 12.8% below the record high. If a full recovery follows, the stock could increase by around 14.7%. However, it could go lower.
NETFLIX, April 11, 2024
Current Price: 611.00
|
Netflix |
Weekly |
|
Trend direction |
|
|
700.000 |
|
|
680.000 |
|
|
655.000 |
|
|
575.000 |
|
|
565.000 |
|
|
560.000 |
Example of calculation based on weekly trend direction for 1.00 Lot1
|
Pivot Points |
||||||
|
Profit or loss in $ |
89,000.00 |
69,000.00 |
44,000.00 |
-36,000.00 |
-46,000.00 |
-51,000.00 |
|
Profit or loss in €² |
82,886.61 |
64,260.41 |
40,977.65 |
-33,527.17 |
-42,840.27 |
-47,496.82 |
|
Profit or loss in £² |
70,955.91 |
55,010.76 |
35,079.33 |
-28,701.27 |
-36,673.84 |
-40,660.13 |
|
Profit or loss in C$² |
121,827.21 |
94,450.31 |
60,229.18 |
-49,278.42 |
-62,966.87 |
-69,811.10 |
- 1.00 lot is equivalent of 1000 units
- Calculations for exchange rate used as of 10:10 (GMT) 11/04/2024
Fortrade recommends the use of Stop-Loss and Take-Profit, please speak to your Senior Account ManagerClient Manager regarding their use.
- You may wish to consider closing your position in profit, even if it is lower than suggested one
- Trailing stop technique can protect the profit – Ask your Senior Account ManagerClient Manager for more detail